General Discussion
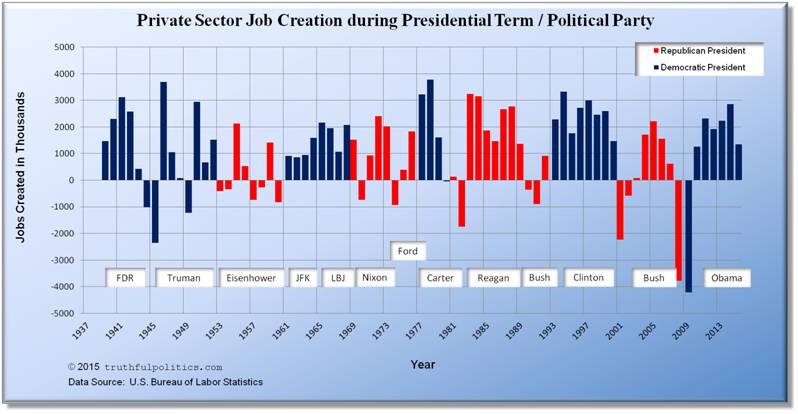
Related: Editorials & Other Articles, Issue Forums, Alliance Forums, Region ForumsInteresting Chart of Job Creation, 1937 -2009
Look at those years when there was negative job growth: The only ones occurring during Dem presidencies are three in the post-WWII era (returning GIs), a barely discernable negative year during Carter, and the first year of Obama's term following the 2008 Crash. (Of course, each subsequent Obama year showed positive growth.)
All other job-loss years were during Repug years: 5 for us; 13 for them.
The DNC should show this chart non-stop during the convention.
 = new reply since forum marked as read
Highlight:
NoneDon't highlight anything
5 newestHighlight 5 most recent replies
= new reply since forum marked as read
Highlight:
NoneDon't highlight anything
5 newestHighlight 5 most recent replies

Blanks
(4,835 posts)On the left Y-axis, and the jobs created on the right Y-axis.
I think that would be interesting too.

JaneQPublic
(7,113 posts)The comparison of Clinton vs. GWBush alone would speak volumes regarding the validity of the two opposing economic theories when applied through two full 4-year terms.
Blanks
(4,835 posts)I'd prefer to copy and paste them rather than print the numbers out and enter them.
JaneQPublic
(7,113 posts)The above link has tables for historical tax rates, one adjusted for inflation and another not.
cbrer
(1,831 posts)Credit on .jpg. Thanks!

Blue_In_AK
(46,436 posts)JaneQPublic
(7,113 posts)The person who developed this chart did provide a great visual showing well over 50 years without negative employment growth on the Dem's watch. Glad more are seeing it.
jtuck004
(15,882 posts)such as Glass-Steagall were enacted, when they were repealed and how, and by whom, maybe with a synopsis of their effect, who wound up with the money.
'Cause I think our greater war is with those who value capital over people, regardless of party.
B Calm
(28,762 posts)not for all the republican governors laying off teachers, firemen, state highway workers, cops, etc etc with their main agenda to make this president a one term president!