General Discussion
Related: Editorials & Other Articles, Issue Forums, Alliance Forums, Region ForumsVoting preference by race from CBS exit poll
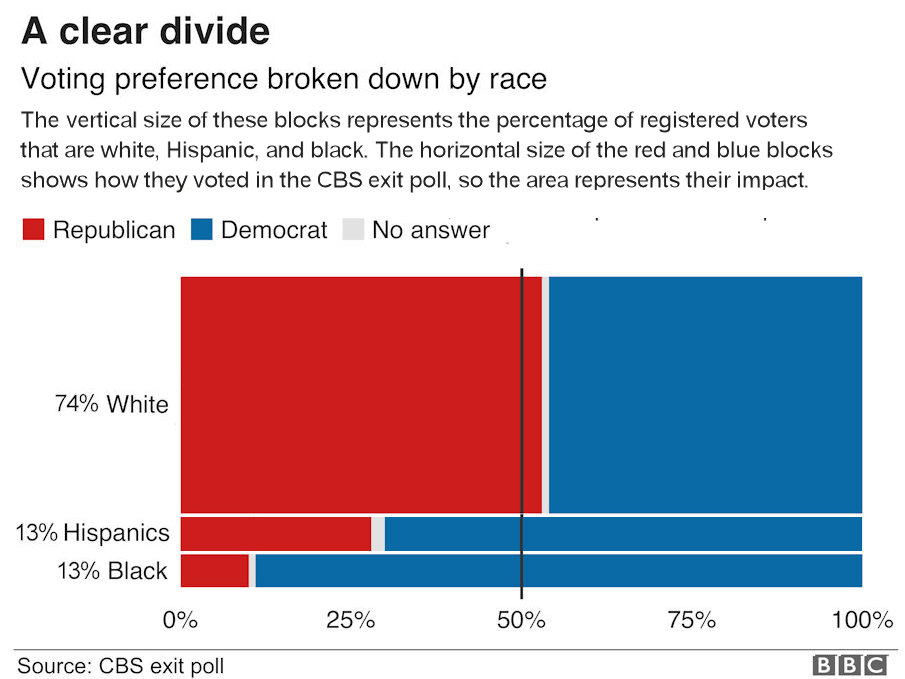
The following is based on a graphic from the BBC site, except that it had bars of equal height, but I have added the percentages of registered voters for each and proportioned the vertical height of the bars to reflect those percentages:
 = new reply since forum marked as read
Highlight:
NoneDon't highlight anything
5 newestHighlight 5 most recent replies
= new reply since forum marked as read
Highlight:
NoneDon't highlight anything
5 newestHighlight 5 most recent replies

brush
(53,771 posts)Is it saying 55% of whites vote repug, as did 13% of AA and Hispanics?
It's hard for me to believe that blacks voted at the same percentage for repugs as Hispanics when in previous elections AA votes for repugs has always been much lower than Hispanices.
NewJeffCT
(56,828 posts)not entirely sure, either, though

William Seger
(10,778 posts)... and the BBC graphic doesn't give exact numbers for those, just the red and blue bar sizes. The numbers I added after each category are the percentages of registered voters, and I have scaled the vertical size of the bars to show those percentages, so that the total votes are represented by the relative red and blue areas.
brush
(53,771 posts)Hispanics than African Americans though. Why is it the same now?
William Seger
(10,778 posts)
karynnj
(59,503 posts)You are correct that about 55% of whites voted for the Republicans, but wrong on Hispanics and African Americans - who were about 30% and 10% respectively (though you really have to guess on the estimate as few points are labeled. The 13% s are the percent they were of the voting population with 74% being white.
brush
(53,771 posts)it one percentage for Hispanics to around 27%.
Awsi Dooger
(14,565 posts)The number is always higher in a midterm because our dependable blocks don't show up while Republican strongholds like older voters absolutely show up. The Florida early voting specifics always looked awful compared to the polls because the electorate was older and more white than the state registration numbers. Marc Caputo detailed that every day.
In 2016 it was 71% whites. Imagine if we run Tuesday's election with 3% fewer whites? We are not worrying about recounts in Florida and Georgia. They are already over the top.
I follow political match closely because I like to wager on races. In 2008 it was already down to 74% whites. Projections were that it would drop 2% every 4 years. That held up to 72% in 2012. However, Trump held it to only a 1% drop down to 71% in 2016, and that drop was offset by the fact that rural and non-college whites now vote considerably more Republican. Instead of 60-40 or 65-35 among those blocks it is now 70-30 and rising all the time. With Trump I won't be shocked if it reaches 76-24 range in 2020.
That changes all the prior projections, the ones that forecast an Emerging Democratic Majority. We couldn't afford for that white vote to become so lopsided, given all the states we depend on that are heavily white, like Iowa and Wisconsin.

58Sunliner
(4,384 posts)You have 74% of whites, yet the graphic is just over 50%?? This is not accurate. And remember that if a state only had 51.3% of all eligible voters voting, the number is not just 73% of whites, if that is even accurate. It is 73% of total white voters who actually voted. Florida had a turnout of 51.3% so you are saying that the percentage of whites, who are approx 67% of population, which would be approx 34% of total voters who actually voted, and of that 34%, 73% voted republican, which is actually 24.82% of the eligible white voters, voted for republicans. Do you see how that works? No percentage stands alone. It represents a part of a whole. Math matters.
On the other hand you also have your graphic stating that Hispanics voted at 13% yet the graphic shows it to be over 25%???? You should take this post down. It is inaccurate.
karynnj
(59,503 posts)How they voted is represented by the length of the red and blue lines - and it is impossible to get precise numbers of those percents.
To make sense of it, consider that it is three rows, representing race with their percent of the total voters given. each row has a blue line reflecting the percent that voted for Democrats and a red line reflecting the percent that voted for the Republicans.
This is a poorly done graphic that is made worse by not having any explanation.
William Seger
(10,778 posts)
William Seger
(10,778 posts)I.e. the graphic is saying that 74% of registered of voters are white, and just over 50% of them voted Republican. My intent was to visually approximate the total votes cast by the relative red and blue areas. My point is that you can tell preferences by the exit polls, but the total effect of those preferences is a function of the total voters for each category. Apparently, it's confusing, but it's as accurate as the assumption about registered voters -- I could only find numbers for registered voters, not actual voters. I don't know how anyone would know that, anyway, but if you have a reliable source, I'll change the graphic.
Awsi Dooger
(14,565 posts)Still early stage. These exit polls are adjusted to match the electorate, and it can take a week or several weeks to finalize.
Then it is further checked in comparison to other sources. The recent trend is that the white percentage of the vote is understated in the early exit polls, which makes sense since whites vote Republican and may be more cynical and reluctant to participate.
https://www.cnn.com/election/2018/exit-polls
Awsi Dooger
(14,565 posts)If you want an early summary, that's the one I would provide right now, after looking at many state and national exit polls.
Women showed up far superior to a typical midterm, at 52% overall and up to 55% in some pivotal states like Florida.
If we pull out Florida, it will be due to that 55% split among women. Unbelievable.
Otherwise the rural white voters stormed to the polls and dominated. Texas did not have nearly the ideological shift that we hoped for, given Beto and all the emphasis. It dipped to only 43% conservatives compared to the normal 44% in presidential years.
Beto has no chance against 43% conservatives. That's why I never had any hope for that race, and it's the reason I wagered heavily on Cruz even if I despise him.
Tennessee was even worse at 44% conservatives and only 17% liberals. That is exactly what Tennessee has become...a no-chance state with 44% conservatives. Bredesen defended as well as can be expected. Without him on the ballot it will probably be closer to 46% conservatives and a massacre.
Very uphill for Abrams in Georgia among 42% conservatives and only 20% liberals. That is the reason I wagered on the Republican in that state, although I refuse to say his name. It is amazing we receive such a good split of the moderate vote in Georgia this days, making the outcomes closer than ideology hints.
Arizona continues to be the most promising new state to turn at 41-21. Not a disaster and worse than the 41-27 from the 2016 exit poll. I suspect Arizona is more liberal than that 41-21 but the mail-ballot realities skews the exit polling.
Nevada is a gem at 35-25. That is becoming a blue state if it has only a 10% gap in a midterm, with only 35% conservatives. When I lived there the midterms were closer to a 20-25 point gap in the early years. I remember being shocked when it dipped below 40% conservatives in a presidential year. To dive all the way down to 35% in a midterm is remarkable.