General Discussion
Related: Editorials & Other Articles, Issue Forums, Alliance Forums, Region Forums1 in 1000 NYC residents have died of Sars-CoV-2
A sobering perspective
https://bdkhealth.com/1-in-1000-new-york-city-residents-have-now-died-from-coronavirus/
According to the data 1,508 in 100,000 people have affected from Covi19 causing 102 deaths per 100,000 people.
NYC’s population in 2019 was around 8.6 Million.
New York City’s death per capita is on par with Italy’s Lombardy.
 = new reply since forum marked as read
Highlight:
NoneDon't highlight anything
5 newestHighlight 5 most recent replies
= new reply since forum marked as read
Highlight:
NoneDon't highlight anything
5 newestHighlight 5 most recent replies

SheltieLover
(57,073 posts)

lindysalsagal
(20,679 posts)My friend is next-of-kin. Gonna be heartbreaking and fiendishly frustrating.
Bernardo de La Paz
(49,000 posts)
Sanity Claws
(21,847 posts)Damn.
I wonder how many will die from it. Maybe 1 out of 500?
Bernardo de La Paz
(49,000 posts)That number is affected by under-testing, and by under-counting of deaths due to dying at home etc.
Bernardo de La Paz
(49,000 posts)Not a reference for that figure, but good info here: https://talkingpointsmemo.com/edblog/the-true-scale-of-excess-mortality-in-nyc with other links in it to follow (April 7).
A chart from James Tozer on twitter
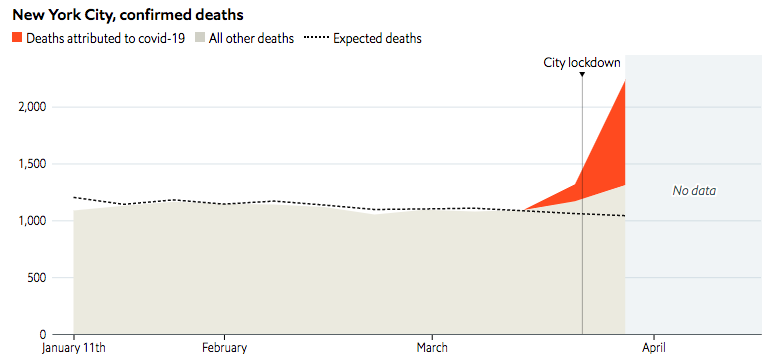
gristy
(10,667 posts)The chart does not say. Deaths per month maybe? As of March 28th (~ the last date plotted on the chart), New York City had a total of 672 deaths attributed to COVID-19.
This chart is confusing at best. Maybe just flat out wrong. Who's James Tozer, anyways?
The article at your talkingpointsmemo link is a lot clearer than that chart...
Bernardo de La Paz
(49,000 posts)gristy
(10,667 posts)It shows a weekly death rate of 1000/week on ~3/28, which is not possible since there had been only 672 deaths total in New York City attributed to covid-19 as of 3/28.
The data that I've been tracking and plotting myself is from here: https://github.com/nytimes/covid-19-data
Bernardo de La Paz
(49,000 posts)have been getting worse ever since.
Don't forget that lockdown means fewer traffic accident deaths, fewer mugging deaths, etc.