General Discussion
Related: Editorials & Other Articles, Issue Forums, Alliance Forums, Region ForumsShocking: Income Inequity Since 1970, In Graph Form
from Bill Moyers & Co.:
http://billmoyers.com/content/the-triggers-of-economic-inequality/
The Triggers of Economic Inequality
By Troy Oxford and Lauren Feeney
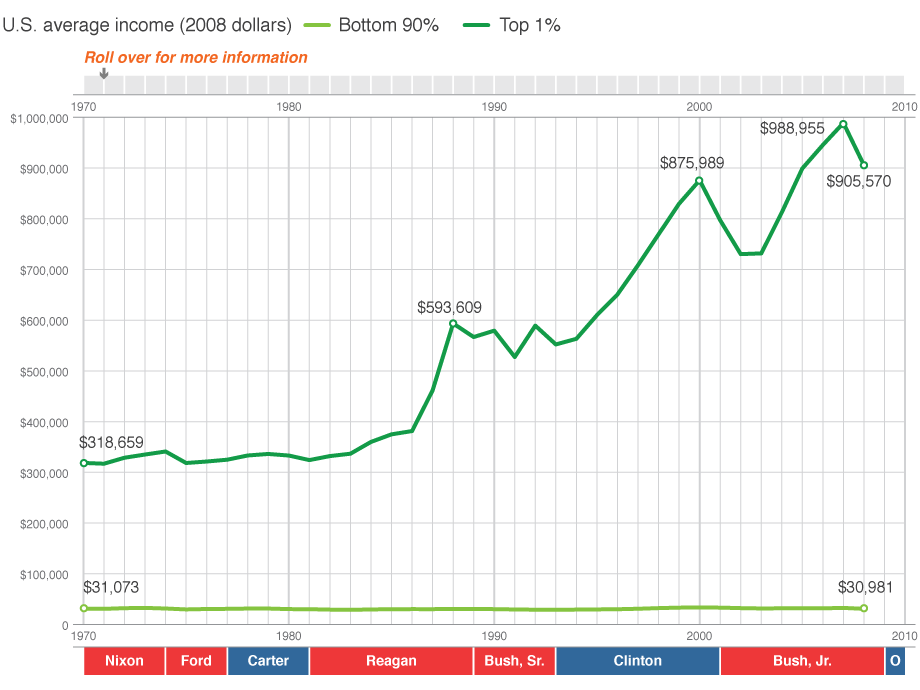
In recent years, the rich have seen their wealth grow dramatically while the poor and middle class have basically flatlined. It’s no accident, argue Jacob Hacker and Paul Pierson in their book Winner-Take-All Politics. The infographic below, which draws from Hacker and Pierson’s book, explains how our politicians — on both sides of the isle — fell under the spell of corporate dollars and re-engineered our economic system to favor the wealthy. The dark green line shows the income trajectory for the top 1 percent since 1970, while the light green line shows the bottom 90 percent. Click the orange triangles to learn about critical turning points that helped create the skewed system we have today.
....(snip)....
Shocking: Income Inequity Since 1970, In Graph Form
We know income inequality has grown exponentially in the last 40 years, but when you see it in graphic form, it's that much more astonishing. Using the new book Winner-Take-All Politics as a basis, Bill Moyers' site line-graphed the way income in America has changed, depicting a flatlining—even slightly declining—income for the bottom 90%, and an explosively inclining income for the top 1%. Further, a ticker notes each year that politicians engineered this mess for the upper echelon through legislation and executive decisions. Perhaps unsurprisingly, the steepest inclines for the rich came under the presidencies of Reagan, Clinton, and George Bush II.
http://www.alternet.org/newsandviews/article/763245/shocking%3A_income_inequity_since_1970%2C_in_graph_form/
 = new reply since forum marked as read
Highlight:
NoneDon't highlight anything
5 newestHighlight 5 most recent replies
= new reply since forum marked as read
Highlight:
NoneDon't highlight anything
5 newestHighlight 5 most recent replies

Neoma
(10,039 posts)
peacebird
(14,195 posts)
malaise
(268,931 posts)I'm so glad he's back
http://billmoyers.com/series/moyers-and-company/

pnorman
(8,155 posts)n/t

PETRUS
(3,678 posts)
xchrom
(108,903 posts)
woo me with science
(32,139 posts)We will have thieves for exactly as long as we consent to vote for thieves.

TBF
(32,047 posts)Not a good combination for 99% of us ...

Trillo
(9,154 posts)woo me with science
(32,139 posts)

FreeJoe
(1,039 posts)The stats I've been seeing ever since the start of OWS show a household income of about $350,000 gets you in the top 1% and that is pre-tax. This CBO data says that having an after-tax income less than $400,000 doesn't even get you in the top 5%. I wonder which is correct. Based on my life experience and guestimates, I have a hard time believing that one out of every hundred American households is netting $1.2 million after taxes. I know very few people bringing in that kind of money.
woo me with science
(32,139 posts)because there is actually a much smaller subset at the very, very, very top whose increases have so outpaced the others that you can't even make a graph that will fit on most pages...their bar is so high.
According to the authors, there is a very tiny group of oligarchs in a fraction of the one percent who are taking home one out of every eight dollars produced in our economy.

kpete
(71,984 posts)holy cow!
a visual shocker-that says it all!
thanks marmar
peace, kpete
divide_and_rule
(16 posts)How about some out of the box thinking?

Gold Metal Flake
(13,805 posts)
RainDog
(28,784 posts)
Greybnk48
(10,167 posts)Stunning.
GeorgeGist
(25,319 posts)How's that triangulation working for ya, chess fans?

cthulu2016
(10,960 posts)The Clinton administration was the only sustained period of real-wage increases since Reagan got into office.

mike_c
(36,281 posts)It looks to me like most of us-- the 90 percent represented by the bottom line-- had more-or-less flat earnings during Clinton's presidency, while the rich profited enormously.
Do you dispute the data presented in the OP? Or might that "sustained period of real-wage increases" you cite have been so paltry that it simply doesn't show up on a graph of this scale? In which case, Clinton's presidency was no better than Reagan's for 90 percent of Americans, and great news for the wealthiest one percent.
cthulu2016
(10,960 posts)This stuff that is well known to everyone who has looked at patterns or American income and wealth distribution from 1980 to the present.
First, on re-reading I see that the poster I replied to was saying that income inequality grew most under Clinton. Fair enough. I was ojecting to Clinton being "the worst" because income inequality is not, in itself, the best measure of how people on the bottom are doing. (But if the raw difference is what is "the worst" then the poster was right.)
Income inequality can increase in good times because a stronger economy favors the rich disproportionately. More economic activity, more opportunities for profit. But that does not mean that working people do better in a bad economy, or that they do equally well in all good economies.
Of course the rich got richer under Clinton. The stock market exploded upward. Rich people have stocks.
But ordinary people captured more of that good economy than under republicans.
The chart in the OP is scaled to maximize the flatness of the bottom line because it is intended to show the huge gains made by the wealthy. All charts are designed to show one or two things clearly.
Here's a good chart of how much of GDP was captured by the median family. It tells the same tragic story as the chart in the OP, with the rich grabbing a huge portion of all economic growth since 1980. But you can see that without the gains (however paltry) of the 1990s the median family share of GDP would be lower than it started out.
Put most simply, any worker would take the 1990s over the 2000s.

mike_c
(36,281 posts)...were so miniscule that they don't even show as a tiny blip on a graph where the wealth inequality curve for the wealthy rises robustly. And THAT was the "greatest rise in real wages since Reagan" or whatever (I'm paraphrasing your earlier response).
Thanks, but I'm not very impressed. In other words, you don't dispute the data the OP presents, but merely want to spin it in a democrat friendly way. You know, that bottom line STILL looks pretty flat during the Clinton years, at least to me.
stevenleser
(32,886 posts)
HughBeaumont
(24,461 posts)
"Who tells the president to 'Speed it Up'?"
The Bankster-Run Corptocracy, that's who. Now and forever.
K & R.
dreamnightwind
(4,775 posts)Caught this show last night, it was excellent. He's going right for the heart of what troubles our nation. Good to have him back on the air.
pampango
(24,692 posts)and its increase starting under Reagan.
Link for the video: http://billmoyers.com/episode/on-winner-take-all-politics/
dreamnightwind
(4,775 posts)The guests that authored the book (I think it was "winner take all" or something similar) kept blaming the growth of inequality to government policies, and saying both sides were to blame.
First, false equivalence. Both sides are to blame, but they're not equally to blame. Republicans own this issue, Democrats attempt to serve 2 masters, the people and the corporations, though the corporations are clearly the most feared master these days (we need to change that, and fast).
But the real problem I had with it is I don't see it as a "throws all the bums out of office" situation at all. The corporations will just coopt the new bums, no problem for them to do so. They've been doing it for years.
I don't see the rise of inequality as being a function of government policy changes so much as it was a function of CORPORATE-written legislation that was pretty much handed to the politicians to approve. It's the corporations, stupid. I don't get why they didn't more squarely focus the blame there, since it's obvious where this all comes from.
The authors would probably agree with me on this, they just weren't stressing it as the root of the problem, or not to my satisfaction anyway.
WillyT
(72,631 posts)