Welcome to DU!
The truly grassroots left-of-center political community where regular people, not algorithms, drive the discussions and set the standards.
Join the community:
Create a free account
Support DU (and get rid of ads!):
Become a Star Member
Latest Breaking News
General Discussion
The DU Lounge
All Forums
Issue Forums
Culture Forums
Alliance Forums
Region Forums
Support Forums
Help & Search
General Discussion
Related: Editorials & Other Articles, Issue Forums, Alliance Forums, Region ForumsUnemployment Is Down, So Whats the Problem?
from Dollars & Sense:
Unemployment Is Down, So What’s the Problem?
By Alejandro Reuss | May/June 2013
The “headline” unemployment rate, or U-3 by its Bureau of Labor Statistics (BLS) designation, has declined from a peak of 10.0% in late 2009 to 7.5% now. The unemployment rate—the number of unemployed people as a percentage of the labor force (the employed plus unemployed)—is still abnormally high. Before the onset of the current crisis, it had been this high for only five months (May-September 1992) in the last 24 years.
Unemployment Rate, 2005-2013
The jobs situation now is certainly drastically different from 2008-2010, when unemployment was increasing dramatically—there’s no argument about that. At the bleakest point of the recession, in each of two consecutive months (January-February 2009), over half a million more people went from being employed to unemployed than from unemployed to employed. In March 2013, in contrast, over 250,000 more people went from being unemployed to employed than the reverse. But the end of the employment freefall is hardly the same thing as a robust recovery.
Employment-Population Ratio, 2005-2013
The trend in the employment-to-population ratio—a much less familiar indicator than the headline unemployment rate—tells a different tale. This figure is the number of employed individuals as a percentage of the working-age civilian noninstitutional population. The civilian noninstitutional population excludes military personnel, people in prison, and so on. Working age, meanwhile, is defined as 16 years and over. So there are two big differences between this measure and the unemployment rate. First, the numerator is employment rather than unemployment (so it's looking at the other side of the employment coin). Second, the denominator is not the labor force (the employed plus the unemployed), but the civilian noninstitutional population (which also includes people who are not in the labor force, or NLF). Here, we see not an employment situation that has turned decisively toward recovery, but that has flatlined for more than three years.
Employed, Unemployed, or Neither
How can the unemployment rate have gone steadily down for about three years with hardly a budge to the employment-population ratio? Shouldn’t the two move in opposite directions? To get a handle on this, we have to look at the way the “headline” unemployment rate is calculated, starting with the official government definition of unemployment. .......................(more)
The complete piece is at: http://www.dollarsandsense.org/archives/2013/0513reuss.html
InfoView thread info, including edit history
TrashPut this thread in your Trash Can (My DU » Trash Can)
BookmarkAdd this thread to your Bookmarks (My DU » Bookmarks)
7 replies, 1956 views
ShareGet links to this post and/or share on social media
AlertAlert this post for a rule violation
PowersThere are no powers you can use on this post
EditCannot edit other people's posts
ReplyReply to this post
EditCannot edit other people's posts
Rec (14)
ReplyReply to this post
7 replies
 = new reply since forum marked as read
Highlight:
NoneDon't highlight anything
5 newestHighlight 5 most recent replies
= new reply since forum marked as read
Highlight:
NoneDon't highlight anything
5 newestHighlight 5 most recent replies
= new reply since forum marked as read
Highlight:
NoneDon't highlight anything
5 newestHighlight 5 most recent replies
Unemployment Is Down, So Whats the Problem? (Original Post)
marmar
May 2013
OP
byeya
(2,842 posts)1. Last month the headline unemployment rate dropped 0.01 and the U-6 gained 0.01.
This is almost a jobless recovery but is on the positive side. It is a low-paying jobs recovery.

bhikkhu
(10,711 posts)2. The employment-population ratio decrease has been predicted for a long time
http://bonddad.blogspot.com/2012/02/baby-boomers-and-declining-labor-force.html
...not that the recession has nothing to do with the current numbers, but about half of the decrease so far is expected, and the decreases are predicted to continue over the next decade or so regardless of economic recovery. Its just retirement time for the baby boomers, and we've had a much lower birthrate since then.
...not that the recession has nothing to do with the current numbers, but about half of the decrease so far is expected, and the decreases are predicted to continue over the next decade or so regardless of economic recovery. Its just retirement time for the baby boomers, and we've had a much lower birthrate since then.
byeya
(2,842 posts)3. When a person retires, he/she is out of the workforce and is not counted as unemployed or
underemployed or part-time-looking-for full-time-work. The headline unemployment rate and other Labor Dept stats count only those in the workforce, those out of the workforce but looking for work, and those having to accept part time work in lieu of a full time job. Retirees don't fit these catagories.
bhikkhu
(10,711 posts)6. Maybe, but here's why that makes no sense:
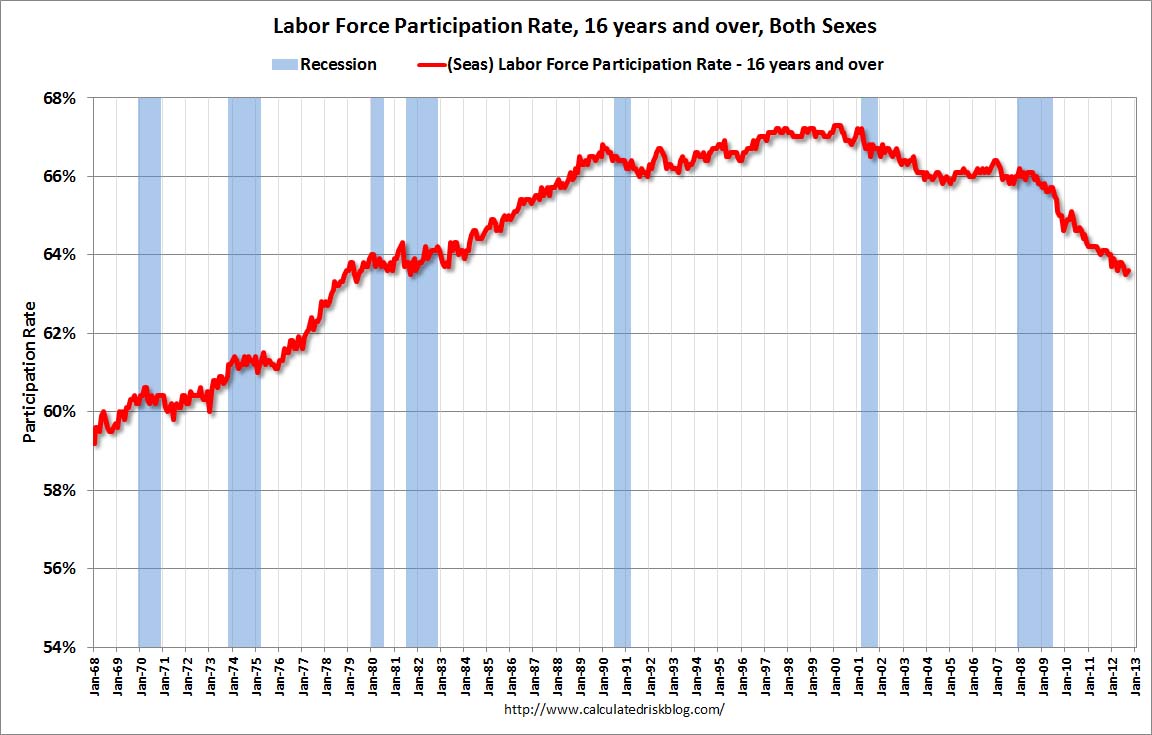
This is a graph of labor force participation, all adults 16+. The decline there makes sense by the "retiring baby boomers" scenario, as the boomers are a large demographic leaving the workforce, so the overall percentage of adults working drops. Following the trend, about 63% of adults over 16 are employed.
If you look at the OP's graph, if it shows a smaller segment of the population (adults 16 - 64) that excludes retiring baby boomers. But how can it exclude retirees, yet wind up with 58% employed? Excluding retirees should wind up with a larger percentage, not a smaller percentage. So something is wrong in the data somewhere...
Info and graphic from this article, btw: http://www.calculatedriskblog.com/2012/10/understanding-decline-in-participation.html
Egalitarian Thug
(12,448 posts)4. K&R In the forlorn hope that someone will read this article. n/t

xchrom
(108,903 posts)5. du rec. nt

ProSense
(116,464 posts)7. "The best explanation is that the decline...
From the OP link:
So why has the labor-force participation rate fallen like a stone in the last few years? None of the standard ways to explain away the precipitous decline is convincing:
<...>
The best explanation is that the decline is the fallout of a severe recession from which we have far from recovered. There simply are not enough jobs. After long spells of unemployment, many people give up on looking for work (“discouraged workers”) and are reclassified as NLF. Others have entered the working-age population-turned 16 years old-or just graduated from high-school or college grads and found few work opportunities. Some older workers retire, leaving the labor force, before they otherwise would have. The declining LFPR, however, is not restricted to younger or older workers. As Heidi Schierholz of the Economic Policy Institute puts it, “(T)he labor force participation rate of the ’prime-age’ population, people age 25-54, is also at its lowest point of the downturn ... . It's the lack of job opportunities—the lack of demand for workers—that is keeping these workers from working or seeking work, not other factors.”
Demographic changes and retirements as a direct result of the crisis are a big factor in the overall labor participation rate. For people age 25 to 54, its the weakness of the recovery.
Calculated Risk:
Since the participation rate declined recently due to cyclical (recession) and demographic (aging population) reasons, an important graph is the employment-population ratio for the key working age group: 25 to 54 years old.
In the earlier period the employment-population ratio for this group was trending up as women joined the labor force. The ratio has been mostly moving sideways since the early '90s, with ups and downs related to the business cycle.
This ratio should probably move close to 80% as the economy recovers. The ratio was unchanged at 75.9% in April. The participation rate for this group was also unchanged at 81.1% in April. The decline in the participation rate for this age group is probably mostly due to economic weakness, whereas most of the decline in the overall participation rate is probably due to demographics.
http://www.calculatedriskblog.com/2013/05/employment-report-comments-and-more.html