General Discussion
Related: Editorials & Other Articles, Issue Forums, Alliance Forums, Region ForumsDon't fall for claims that Labor Participation rate decline is all about baby boomers
Everyone knows, and has known for decades, that the labor force participation rate would decline throughout the first third of the 21st century. Obvious. Nothing new. The aging of the baby boomer bulge. Well expected stuff.
So when the labor situation fell apart in the global crisis and didn't magically fix itself, some folks went, "Must be that baby boomer thing we were expecting." That was a much less demanding answer than, "We need deep change in our whole job-creating engine."
And it is a good political answer because it muddies the waters and suggests a plausible reason to pretend there isn't a problem.
But we suffered a participation shock within a smooth, generation-long demographic effect. (It's not like everyone suddenly turned 65 in the fall of 2008)
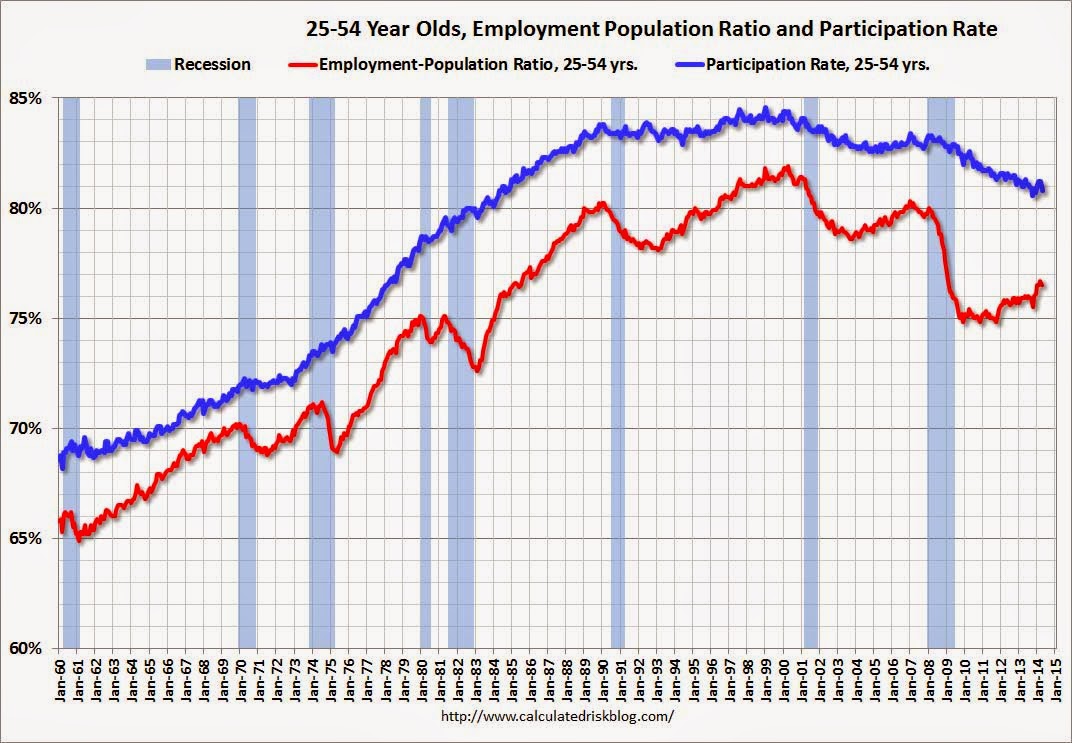
Serious economists do not fixate on the participation rate as the one expression of how many folks are working. For short and medium term effects they pay close attention to the employment/population ratio age 25-54. This is done to remove the bulk of noise arising from age-demographics and to filter out changes in typical retirement age and percentage of people going to college.
This ratio, unlike the participation rate, is agnostic about the size of the "work force" (which is self-defined) and relies on the objectively defined number of people 25-54.
And guess what? It turns out that declining labor participation is NOT a ho-hum, we did that on purpose, demographic factor.
It's not like nobody actually thinks about these things. It is just that the serious folks get drowned out by noise. But the information exists.
For instance, here is a chart that understands very, very well about the demographic element of labor participation. It is all over it, including two projections of the effect.
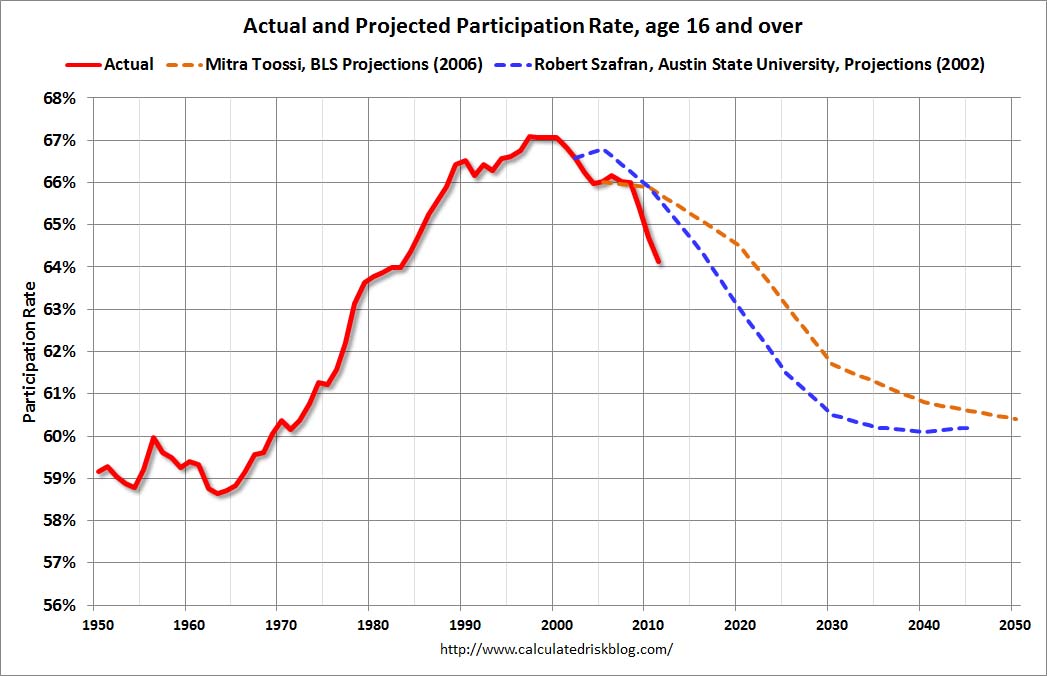
And for some reason the red line (reality) is worse than the demographic effect can account for, and much worse than the BLS estimate, which is recent. In 2006 the BLS estimated what would happen. Only two years later the world economy blew up. It is easy to see the difference between the RED line and the dashed orange line. That difference is the effect in question, and it is caused by the world economy blowing up.
(And also... hasn't a social feature of the last 5-6 years been many people NOT retiring as early as they had hoped or planned?)
Charts/Background: http://www.calculatedriskblog.com/2014/05/comments-on-employment-report.html
 = new reply since forum marked as read
Highlight:
NoneDon't highlight anything
5 newestHighlight 5 most recent replies
= new reply since forum marked as read
Highlight:
NoneDon't highlight anything
5 newestHighlight 5 most recent replies

Fred Sanders
(23,946 posts)If only people knew what the experts in control of policy knew, if only truth could trump politics for a change.

cthulu2016
(10,960 posts)what *they* think is doable and thus never present an expert opinion on the actual situation to those they are supposed to advise.

jwirr
(39,215 posts)retire. That did not happen. Outsourcing happened.
cthulu2016
(10,960 posts)The BLS (Bureau of Labor Statistics) are the folks who do the monthly employment report, calculate the unemployment rate, etc..
We have a very good idea of what the BLS *EXPECTED* in 2006, right before the economic collapse. That is the orange line. That is what was expected.
The red line is what happened. It is not the same as what was expected.
So people saying "nothing to see here, this was expected" are just saying something that is not true.
As to why... no idea. Ask them.