Welcome to DU! The truly grassroots left-of-center political community where regular people, not algorithms, drive the discussions and set the standards. Join the community: Create a free account Support DU (and get rid of ads!): Become a Star Member Latest Breaking News General Discussion The DU Lounge All Forums Issue Forums Culture Forums Alliance Forums Region Forums Support Forums Help & Search
cthulu2016

(10,960 posts)
Mon Apr 23, 2012, 12:09 PM Apr 2012

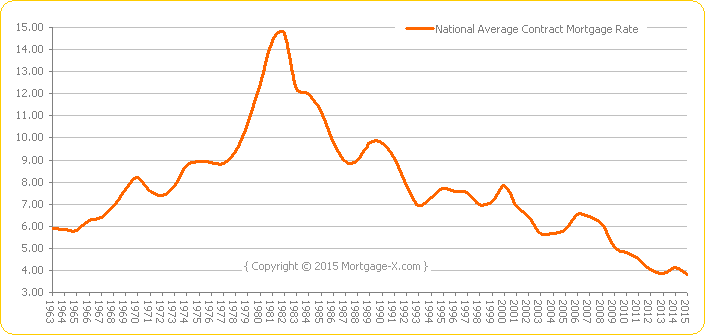
Find Reagan on this chart


Were working people making more relative gains on the left side of this mountain, or on the right side?

What, if anything, does this say about the position of labor in an inflationary environment versus a deflationary environment?

In every economic chart it is easy to spot the deflection point of 1978-1982. The global economy changed at that point. Was it for the better or for the worse? And why?
2 replies = new reply since forum marked as read
Highlight: NoneDon't highlight anything 5 newestHighlight 5 most recent replies
Find Reagan on this chart (Original Post) cthulu2016 Apr 2012 OP
Beats the hell out of me zeemike Apr 2012 #1
If the Question is About Mortgage Rate Trends, On the Road Apr 2012 #2

zeemike

(18,998 posts)
1. Beats the hell out of me
Mon Apr 23, 2012, 12:18 PM
Apr 2012

I don't even understand what a contract mortgage rate is...
But what I do know that before Reagan one working person could support a family and now it takes two or more....so the conclusion for working people is obvious.
Course this does not apply to income that is not earned because their prosperity is based on how much they can take from others...with things like contract mortgage rates...

On the Road

(20,783 posts)
2. If the Question is About Mortgage Rate Trends,
Mon Apr 23, 2012, 02:28 PM
Apr 2012

Reagan had less to do with it than Carter, who appointed Paul Volcker to the Fed.

Double-digit inflation preceded Carter, of course, but it was Volcker who allowed interest rates to spike by controlling monetary growth and letting interest rates fluctuate. Once they peaked in 1981 and inflation began to subside due to less demand and lower oil prices, interest rates began to fall as well.

Reagan, of course, reappointed Volcker after he accomplished what many people thought was impossible -- namely, killing inflation while restoring economic growth. But that was a good reappointment.

I doubt labor or wages are key factors in this chart. The spike in interest rates in the late 70s was due to previous inflation caused by a long-term boom and the two oil shocks caused by OPEC and (in the second case) Iran. Fortunately, it led to a long period of sustained growth.

Latest Discussions»General Discussion»Find Reagan on this chart