General Discussion
Related: Editorials & Other Articles, Issue Forums, Alliance Forums, Region ForumsThis chart shows just how expensive living in America has become throughout the decades
It is not fair for anyone to compare the ability of people of current generations in making a living compared to people long ago. This article compared prices in 1938 to prices today, with 1938 prices adjusted to inflation for 2013, compared with actual costs today, is quite stunning:
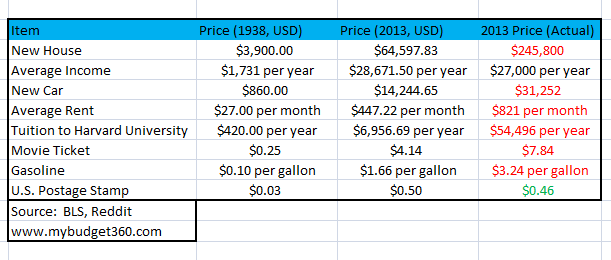
This chart shows the impact of inflation and the declining purchasing power of the US dollar. For example, a new home adjusting for inflation (using the BLS calculator) should cost around $64,597 per year. The current cost of a new home? $245,800. The average income has stayed about the same normalizing for inflation (doesn’t say much since we are going back to the Great Depression here). A new home today costs nearly 10 times the annual average income of a worker. The two income trap has largely hidden this inflation since it now takes two households to accomplish what one income was able to do 75 years ago. On top of that, people now need to go into massive debt just to purchase a home.
Take a look at the cost of a new car as well. In 1938 a worker was able to purchase a new car with one-third of their annual income. Today a new car is more expensive than the annual average income. This is why in 2013 one of the top growing consumer debt sectors was with automobile loans. If things stayed the same, the cost of attending Harvard for one year in 2013 would be closer to $7,000 per year (the current tuition is $54,496 per year). It isn’t only Harvard charging incredibly high tuition around the country. Of course the higher education bubble is one of the most pressing issues around creating a $1.2 trillion student debt market.
Rent, movie tickets, and even gasoline are much more expensive today adjusting for inflation. This puts a heavier strain on the pocketbook of most Americans. It also has created a dependency on debt. We do have stronger safety nets so we don’t have the “in your face” poverty of the Great Depression. Yet we still have close to 48 million Americans on food stamps. The area that has seen prices become more affordable is with food. This however is largely derived from better access to food and products and the mass production of this commodity. Yet the bigger costs of living in housing, cars, rent, and going to college are all much more expensive today. It may feel cheaper to some if they only look at their monthly debt payment but the true costs have increased.
 = new reply since forum marked as read
Highlight:
NoneDon't highlight anything
5 newestHighlight 5 most recent replies
= new reply since forum marked as read
Highlight:
NoneDon't highlight anything
5 newestHighlight 5 most recent replies

Skittles
(153,150 posts)!

mountain grammy
(26,619 posts)funny how the real cost of living has nothing to do with what is reported as "inflation"

StarzGuy
(254 posts)...is a joke. A few pennies on the dollar has virtually no positive effect on my ability to live a decent life after I have become disabled and can no longer can work (after 30 plus years as an educator).

Enthusiast
(50,983 posts)And there is no legitimate reason for it.
BlueJazz
(25,348 posts)The cost of rent/housing is the big ticket item that kills spending in other areas for the average family.
For the person making even a fair amount over the minimum wage, it's impossible.

jwirr
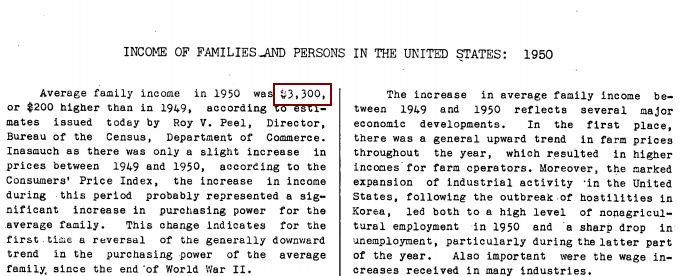
(39,215 posts)they should have used prices from 1945 not 1938. During the Depression it was very hard to afford even those costs which is what is happening to our economy today. By 1945 we were not longer in a depression and wages were good.
In 1945 my father spent $2000.00 to build our house a 3 bedroom basement house (first floor was in the basement built back into a hill). There was also no bathroom - we had an outhouse until 1953. That did not include finishing out the inside. We lived without walls inside for years. Just 2-by-4s. Also many of the houses back then were much smaller than those built after 1950.
Cousins of mine built their home buy putting in the basement first and living in it with 3 children until years later they were able to add the second story.
I think it this kind of a part at a time building may have kind of fudged the real cost of housing back then.
PowerToThePeople
(9,610 posts)can not counterbalance the overinflated large ticket necessities.

Curmudgeoness
(18,219 posts)This just seemed unbelievable. So I checked several inflation calculators, and these conversions to 2013 dollars are right. I also checked the median personal income, because I thought that average income was too low....it is also right.
Add to this how many more expenses we have today that were not there in 1938, like telephone service, pay TV (cable/satellite), internet, health insurance (that few had in 1938 and since costs were so much lower, few really needed), auto insurance, retirement savings to last a longer time because we are living longer (life expectancy in 1938 was about 63-64, it is about 78 today). The list goes on and on.

Auggie
(31,167 posts)Double pane windows, improved insulation, more efficient HVAC systems, etc (plus, they're probably larger too). I would think those systems would add expense based on just their concept and/or design. Same could be said of most automobiles -- metal alloys, safety features, options, etc.
AZ Progressive
(3,411 posts)being more advanced?
With housing, remember that's considering the whole housing stock, not just new houses.
On Edit: Tech prices have largely gone down because of the outsourcing to China.
Spitfire of ATJ
(32,723 posts)If you rented it should be no more than 1/4 of you income.
In the 80s I was renting a 3 bedroom 2 bath in a luxury apartment complex in SoCal for $500 a month. Olympic size pool, weight room, sauna, jacuzzi, locking garages, washer/dryer in the apartment, vaulted ceilings, the works. Plus it was free heating and air conditioning.
That price will barely get you in a roommate situation now with kitchen privileges. I've seen studios going for over $1,500 a month.
awoke_in_2003
(34,582 posts)I make a hair under 70, so it looks like I have stayed within my means.

ensemble
(164 posts)The per capita income in 2013 was about $27K per year, household median income was about $50K per year and average household income was about $70k per year. So the number they report for income in 2013 appears to be per capita income.
The US nominal GDP in 1938 was $87 Billion, the population was 130 million, so the GDP per capita was about $670. The income per person cannot be larger than the GDP per person. The number they report for average income in 1938 is too high, or they are not comparing apples to apples.
AZ Progressive
(3,411 posts)
ensemble
(164 posts)inflation adjusted median household income, which it says is about 3.5 times as high in the 2000's as compared to the late 1930's.
Your original table implied that income was the same (inflation adjusted) today as in 1938, which I don't believe is accurate.

jeff47
(26,549 posts)First, not all income comes from domestic sources.
Also, "savings" is not in GDP, but could produce income. Your company sells shares of stock. The people buying that stock are saving. Thus those purchases are not in GDP. Theoretically, you go spend the money on buying/making stuff, but it's very unlikely you'll spend all the stock proceeds in one year. Which means the total proceeds of your stock sale are not in GDP for that year.
ensemble
(164 posts)Not all of the value of goods produced is going be paid out as income, so generally GDP per capita should be higher than income per capita. I suppose you could think of exceptions where income is higher than GDP, but I doubt that has happened in the US in aggregate.
The graph in the link indicates that from 1945 to the late 1970's, GDP per capita was roughly equal to household income. So that means income per capita was less than GDP per capita (with income becoming relatively smaller after the late 70's).
http://economistsview.typepad.com/economistsview/2008/09/gdp-per-capita.html
jeff47
(26,549 posts)So comparing it to 1945 and later is minimally useful. FDR had just reversed his mistaken "austerity" from 1936, and there was a lot of global economic chaos still going on from the Depression and the run up to WWII.
Or put more simply, there's nothing in how GDP is calculated that requires it to behave the way you say. It tends to work like you describe, but does not have to work like you describe.
Dont call me Shirley
(10,998 posts)AZ Progressive
(3,411 posts)It might be useful to first look at a few common items from 1950:
The average family income: $3,300
The average car cost: $1,510
The median home price: $7,354
These are three very important metrics when it comes to measuring purchasing power in the United States. Since we consider having a car and a home as cornerstones to a middle class lifestyle, it is useful to look at these figures since we can easily grab these figures from reliable sources.
See below for source data:
Source: US Department of Commerce
Then we can see the median home price:
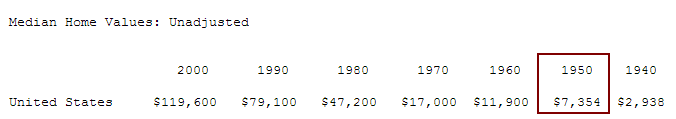
Source: US Census
Adjusted to 2014, those figures would be:
Average family income: $32,416
Average car cost: $14,833
The median home price: $72,239
Compare this to 2014, from the same article:
The average family income: $51,017
The average car cost: $31,252
The median home price: $188,900
ensemble
(164 posts)Median household income climbed into the mid 1960's to about $35-40k/yr, then stagnated until the 1990's, when it climbed to about $50k per year, and has stagnated since.
Car prices have risen, but you get a much better product today, and it is possible to buy a new vehicle for under $20k.
House prices have gone up partly due to increase in square footage, but I bet cost per square foot has outpaced inflation.
I would guess mortgage debt is much higher now, which helps drive up house prices.