UPDATE: U.S. unemployment fell to 3.6 percent, lowest since 1969
Source: Washington Post
The U.S. economy added 263,000 jobs in April, notching a record 103 straight months of job gains and signaling the current economic expansion shows little sign of stalling.
The unemployment rate fell to 3.6 percent percent, the Labor Department said Friday, the lowest since 1969. The official unemployment rate has been at or below 4 percent for more than a year. The United States has more job openings than unemployed people, a situation some economists call "full employment" since most job seekers are able to land a job.
In the years after the Great Recession there was deep concern that wages weren't rising and Americans who had lost jobs had lost hope of getting one again. But there's been good news on both of those fronts in recent months as the abundance of "we're hiring" signs across the nation has helped lured people back into the labor force and push pay higher.
Low unemployment has forced employers to raise wage and become more aggressive about hiring and training workers. Average hourly earnings rose 3.2 percent in the past year, well above inflation, and lower wage workers enjoyed some of the largest gains as companies scrambled to fill jobs and many states have raised their minimum wage.
Read more: https://www.washingtonpost.com/business/2019/05/03/us-economy-added-jobs-april-unemployment-fell-percent-lowest-since/?utm_term=.08d2f4c1e811
I know our resident economy trackers will be along shortly to fill in the BLS data! TGIF!
EDIT: WaPo keeps changing their headline.

Previous headline: U.S. economy added 263,000 jobs in April as unemployment fell to 3.6 percent, lowest since 1969
Original article and headline -
By Washington Post Staff
May 3 at 8:32 AM
Hiring remains strong as the U.S. economy added more jobs than expected in April, marking a record 103 straight months of job gains. The unemployment rate fell to 3.6 percent.
This is a developing story. It will be updated.
https://www.washingtonpost.com/news/business/wp/2019/05/03/the-u-s-economy-added-263000-jobs-in-april-beating-expectations-as-record-hiring-streak-continues/?utm_term.ebfb7c3c4293
 = new reply since forum marked as read
Highlight:
NoneDon't highlight anything
5 newestHighlight 5 most recent replies
= new reply since forum marked as read
Highlight:
NoneDon't highlight anything
5 newestHighlight 5 most recent replies

Bernardo de La Paz
(48,930 posts)
BumRushDaShow
(128,269 posts)Something I would hope the business media SHOULD make a note of. 
beachbum bob
(10,437 posts)tight, where are the pay raises?

Yavin4
(35,406 posts)We live in a gig economy. Anyone can drive a Uber or Lyft. Anyone can deliver food for GrubHub. Anyone can work in the warehouses for Amazon, etc.
When we see these UE numbers, we think of 40 hour a week jobs with good pay and benefits because that's how we've been conditioned to think. However, that's no longer the case.

FBaggins
(26,714 posts)"Gigs" are not significantly different from jobs like a "handyman" without an employer. What difference there is between the two is tied up in the technology used to find customers... but both are essentially self-employed laborers picking up odd jobs.
When we see these UE numbers, we think of 40 hour a week jobs with good pay and benefits because that's how we've been conditioned to think. However, that's no longer the case.
If all you look at is the headline U3 figure, that could be true. But BLS puts out far more data than that. Available statistics definitely include those who are underemployed.
Yavin4
(35,406 posts)not the other data points. The issue is not with the reports. The issue is this. Is what's being report an accurate depiction of the state of the economy? Someone working 30 hours one week, 50 hours the next, 40 hours the next, and 5 hours the next will be reported as fully employed. Yet, to that employee, they do not feel fully employed.
Employment, as defined by the BLS, does not have the same meaning as it once did. This is why incomes are not rising at 3.6% U3 which is considered full employment. At this level, we should be seeing huge spikes in wages as the pool of available labor is tightening.
progree
(10,884 posts)Last edited Fri May 3, 2019, 02:00 PM - Edit history (1)
Wasn't aware of that. I know there are a lot of myths out there about how Clinton changed the unemployment rate, but aren't true.
Wages, and inflation-adjusted wages are increasing, but, yes, not at the rate some economists expected.
Some people make an enormous hoohah about nominal wages not increasing as much as in past periods of low unemployment, but they leave out that inflation back then was quite a bit higher than the current 1.9% rate (CPI-U March 2019 over March 2018).
On the other hand, why aren't we seeing higher inflation given the low unemployment rate? Dunno.
EDITED:
On 2nd thought, Janet Yellen, when she was Fed Chair, used to say that there was more slack in the labor market than was indicated by the unemployment rate statistic.
How the BLS measures unemployment hasn't changed, rather the economy has changed, to a more informal giggy economy.
FBaggins
(26,714 posts)Some people never read beyond that, but that's their fault. The BLS reports the full dataset.
Employment, as defined by the BLS, does not have the same meaning as it once did.
Not true to my knowledge. Can you back the claim up?
This is why incomes are not rising at 3.6% U3 which is considered full employment.
Actually... it's well below what we historically considered "full employment", and that statement was true for a few years but is not currently true. Wage growth over the last 12 months was notably higher than inflation.
progree
(10,884 posts)On 2nd thought, Janet Yellen, when she was Fed Chair, used to say that there was more slack in the labor market than was indicated by the unemployment rate statistic.
How the BLS measures unemployment hasn't changed, rather the economy has changed, to a more informal giggy economy.
As for the part-time issue -- there are BLS statistics for voluntary part-time workers and for part-time workers who say they want a full-time jobs.
# Part-Time Workers who want Full-Time Jobs (Table A-8's Part-Time For Economic Reasons) http://data.bls.gov/timeseries/LNS12032194
# Part-Time Workers (Table A-9) http://data.bls.gov/timeseries/LNS12600000
# Full-Time Workers (Table A-9) http://data.bls.gov/timeseries/LNS12500000
The U-6 unemployment rate (sometimes called the underemployment rate) counts part-time workers who say they want full-time work as unemployed in this statistic. http://data.bls.gov/timeseries/LNS13327709
Yavin4
(35,406 posts)That's pretty high for a 10 year+ recovery with interest rates at 0 for most of that time.
Bernardo de La Paz
(48,930 posts)Where are the pay raises? In the art collections and real estate portfolios of the 1%, the 0.1% and especially the 0.01%.
That's why housing prices are so high, and the art market is so high. Unlike the tRump-RepubliCon pitch, tax cuts for the rich do NOT go into productive investment. Productive investment opportunities are hard to find but the capital for them is already plentiful.
beachbum bob
(10,437 posts)democrats can ATTACK the record
its not longer "can't we just all get along" time in America
Bernardo de La Paz
(48,930 posts)beachbum bob
(10,437 posts)
mahatmakanejeeves
(57,260 posts)In April, average hourly earnings for all employees on private nonfarm payrolls rose by 6 cents to $27.77. Over the year, average hourly earnings have increased by 3.2 percent. Average hourly earnings of private-sector production and nonsupervisory employees increased by 7 cents to $23.31 in April. (See tables B-3 and B-8.)

idahoblue
(377 posts)My ex employer, a hospital, pays the CEO over a million $$$ a year, the next 5 positions are close to that. They are all “on the payroll”.
The lower end start at about $10/hour.
I don’t know the numbers, but averaging the CEO with those who do the work would make it appear that wages are much higher than they are.
progree
(10,884 posts)Last edited Fri May 3, 2019, 12:21 PM - Edit history (2)
who are workers that don't have anyone reporting to them.
Real, i.e. inflation-adjusted hourly earnings of production and non-supervisory earings
https://data.bls.gov/timeseries/CES0500000032
The page won't load (strange, but has never happened to me in all my years of doing this), but as of last month report, it was up 2.17% over the past 12 months. Again, that is inflation-adjusted, i.e. after inflation.
The server is temporarily unable to service your request due to maintenance downtime or capacity problems. Please try again later.
Probably some budget cuts.
EDITED - I got it:
Monthly figures, in 1982-1984 dollars
2017 9.17 9.19 9.21 9.22 9.24 9.26 9.27 9.24 9.23 9.22 9.21 9.22
2018 9.20 9.20 9.23 9.24 9.24 9.24 9.24 9.27 9.29 9.27 9.32 9.37
2019 9.39 9.39 9.38(P)
(P) = Preliminary. Hmm, a bit of a drop last month. Up only a penny in the last 3 months.
It only goes through March because CPI data for April doesn't come out until about mid-May. But anyway, March-over-March is 9.23 -> 9.38 = +1.63% (again that's after adjusting for inflation)

^- DAMN GRAPH used to "stick" for a month until the next jobs report. But lately (in about the past year or so) it's been disappearing in less than a day. Anyway the graph is displayed at https://data.bls.gov/timeseries/CES0500000032
The nominal earnings (no inflation adjustment) is at https://data.bls.gov/timeseries/CES0500000008
oldsoftie
(12,481 posts)
gldstwmn
(4,575 posts)However you cannot buy a home, a car or even pay rent with that. You'd be lucky to get sufficient groceries.
Yavin4
(35,406 posts)The labor market cannot get much tighter than it is currently. We should be seeing much, much higher wage increases.
BumRushDaShow
(128,269 posts)Probably in small towns that people gave up on and abandoned years ago.
It's gonna take a LONG time to fix the mess that Shrub created.
LogicFirst
(571 posts)So much for wage increases.
progree
(10,884 posts)
machoneman
(3,994 posts)administration.

at140
(6,110 posts)to work for lower wages. That is the real reason wages are not rising at higher rate than inflation.
FBaggins
(26,714 posts)Who knew the Trump administration had been in power so long.

LogicFirst
(571 posts)mahatmakanejeeves
(57,260 posts)Original: U.S. economy grew 3.2 percent in early 2019, smashing expectations
Revised: U.S. economy grew 3.2 percent in early 2019, surpassing expectations
They're making it less click-baity.
Thanks for the thread. I saw it at 8:35 at L'Enfant Plaza while on Metrorail car 2002, one of the oldest ones still in revenue service.
Anyway:
Economic News Release USDL-19-0731
Employment Situation Summary
Transmission of material in this news release is embargoed until 8:30 a.m. (EDT) Friday, May 3, 2019
Technical information:
Household data: (202) 691-6378 * cpsinfo@bls.gov * www.bls.gov/cps
Establishment data: (202) 691-6555 * cesinfo@bls.gov * www.bls.gov/ces
Media contact: (202) 691-5902 * PressOffice@bls.gov
THE EMPLOYMENT SITUATION -- APRIL 2019
Total nonfarm payroll employment increased by 263,000 in April, and the unemployment rate declined to 3.6 percent, the U.S. Bureau of Labor Statistics reported today. Notable job gains occurred in professional and business services, construction, health care, and social assistance.
This news release presents statistics from two monthly surveys. The household survey measures labor force status, including unemployment, by demographic characteristics. The establishment survey measures nonfarm employment, hours, and earnings by industry. For more information about the concepts and statistical methodology used in these two surveys, see the Technical Note.
Household Survey Data
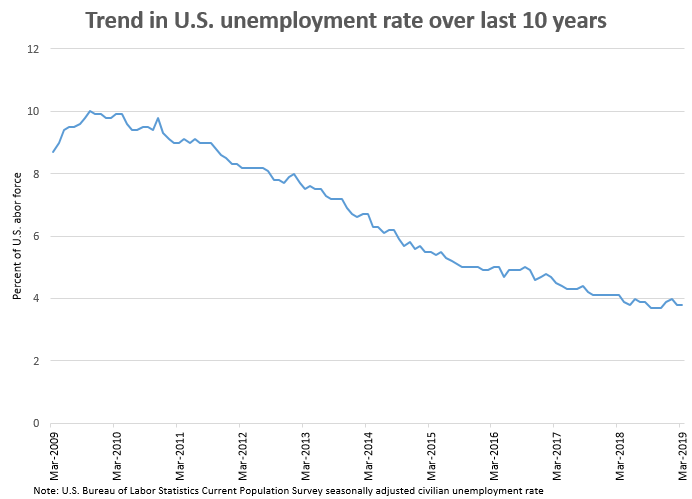
The unemployment rate declined by 0.2 percentage point to 3.6 percent in April, the lowest rate since December 1969. Over the month, the number of unemployed persons decreased by 387,000 to 5.8 million. (See table A-1.)
Among the major worker groups, the unemployment rates declined in April for adult men (3.4 percent), adult women (3.1 percent), Whites (3.1 percent), Asians (2.2 percent), and Hispanics (4.2 percent). The jobless rates for teenagers (13.0 percent) and Blacks (6.7 percent) showed little or no change. (See tables A-1, A-2, and A-3.)
Among the unemployed, the number of job losers and persons who completed temporary jobs declined by 186,000 over the month to 2.7 million. (See table A-11.)
In April, the number of persons unemployed less than 5 weeks declined by 222,000 to 1.9 million. The number of long-term unemployed (those jobless for 27 weeks or more) was little changed at 1.2 million in April and accounted for 21.1 percent of the unemployed. (See table A-12.)
The labor force participation rate declined by 0.2 percentage point to 62.8 percent in April but was unchanged from a year earlier. The employment-population ratio was unchanged at 60.6 percent in April and has been either 60.6 percent or 60.7 percent since October 2018. (See table A-1.)
The number of persons employed part time for economic reasons (sometimes referred to as involuntary part-time workers) was little changed at 4.7 million in April. These individuals, who would have preferred full-time employment, were working part time because their hours had been reduced or because they were unable to find full-time jobs. (See table A-8.)
In April, 1.4 million persons were marginally attached to the labor force, little different from a year earlier. (Data are not seasonally adjusted.) These individuals were not in the labor force, wanted and were available for work, and had looked for a job sometime in the prior 12 months. They were not counted as unemployed because they had not searched for work in the 4 weeks preceding the survey. (See table A-16.)
Among the marginally attached, there were 454,000 discouraged workers in April, about unchanged from a year earlier. (Data are not seasonally adjusted.) Discouraged workers are persons not currently looking for work because they believe no jobs are available for them. The remaining 963,000 persons marginally attached to the labor force in April had not searched for work for reasons such as school attendance or family responsibilities. (See table A-16.)
Establishment Survey Data
Total nonfarm payroll employment increased by 263,000 in April, compared with an average monthly gain of 213,000 over the prior 12 months. In April, notable jobs gains occurred in professional and business services, construction, health care, and social assistance. (See table B-1.)
Professional and business services added 76,000 jobs in April. Within the industry, employment gains occurred in administrative and support services (+53,000) and in computer systems design and related services (+14,000). Over the past 12 months, professional and business services has added 535,000 jobs.
In April, construction employment rose by 33,000, with gains in nonresidential specialty trade contractors (+22,000) and in heavy and civil engineering construction (+10,000). Construction has added 256,000 jobs over the past 12 months.
Employment in health care grew by 27,000 in April and 404,000 over the past 12 months. In April, job growth occurred in ambulatory health care services (+17,000), hospitals (+8,000), and community care facilities for the elderly (+7,000).
Social assistance added 26,000 jobs over the month, with all of the gain in individual and family services.
Financial activities employment continued to trend up in April (+12,000). The industry has added 110,000 jobs over the past 12 months, with almost three-fourths of the growth in real estate and rental and leasing.
Manufacturing employment changed little for the third month in a row (+4,000 in April). In the 12 months prior to February, the industry had added an average of 22,000 jobs per month.
Employment in retail trade changed little in April (-12,000). Job losses occurred in general merchandise stores (-9,000), while motor vehicle and parts dealers added 8,000 jobs.
Employment in other major industries, including mining, wholesale trade, transportation and warehousing, information, leisure and hospitality, and government, showed little change over the month.
In April, average hourly earnings for all employees on private nonfarm payrolls rose by 6 cents to $27.77. Over the year, average hourly earnings have increased by 3.2 percent. Average hourly earnings of private-sector production and nonsupervisory employees increased by 7 cents to $23.31 in April. (See tables B-3 and B-8.)
The average workweek for all employees on private nonfarm payrolls decreased by 0.1 hour to 34.4 hours in April. In manufacturing, both the workweek and overtime were unchanged (40.7 hours and 3.4 hours, respectively). The average workweek for production and nonsupervisory employees on private nonfarm payrolls held at 33.7 hours. (See tables B-2 and B-7.)
The change in total nonfarm payroll employment for February was revised up from +33,000 to +56,000, and the change for March was revised down from +196,000 to +189,000. With these revisions, employment gains in February and March combined were 16,000 more than previously reported. (Monthly revisions result from additional reports received from businesses and government agencies since the last published estimates and from the recalculation of seasonal factors.) After revisions, job gains have averaged 169,000 per month over the last 3 months.
_____________
The Employment Situation for May is scheduled to be released on Friday, June 7, 2019, at 8:30 a.m. (EDT).
* * * * *
[center]Facilities for Sensory Impaired[/center]
Information from these releases will be made available to sensory impaired individuals upon request. Voice phone: 202-691-5200, Federal Relay Services: 1-800-877-8339.
BumRushDaShow
(128,269 posts)
Their "breaking news" headlines crack me up with the length and then they eventually shorten them for the full articles. You would think it would be the reverse.

And was looking for and found this -
So the February numbers, although revised upwards, they were still pretty low. I think there has been quite a bit of reorganization going on in various sectors and it may take awhile for those affected to actually get back to where they were (I know I have a relative caught up in that).
mahatmakanejeeves
(57,260 posts)[center]Past Performance is Not a Guarantee of Future Results.[/center]
Nonetheless, what is important is not this month's results, but the trend. Let’s look at some earlier numbers:
ADP® (Automatic Data Processing), for employment in April 2019:
ADP National Employment Report: Private Sector Employment Increased by 275,000 Jobs in April
Bureau of Labor Statistics, for employment in March 2019:
UPDATE: U.S. added 196,000 jobs in March as economy shows signs of spring bounce
ADP® (Automatic Data Processing), for employment in March 2019:
Private sector hiring falls to 18-month low, and manufacturing sheds jobs, ADP says
Bureau of Labor Statistics, for employment in February 2019:
U.S. adds meager 20,000 jobs in February to mark smallest increase in 17 months
ADP® (Automatic Data Processing), for employment in February 2019:
ADP National Employment Report: Private Sector Employment Increased by 183,000 Jobs in February
Bureau of Labor Statistics, for employment in January 2019:
U.S. creates 304,000 jobs in January, unemployment rises to 4%
ADP® (Automatic Data Processing), for employment in January 2019:
U.S. added 213,000 private-sector jobs in January, ADP says
Bureau of Labor Statistics, for employment in December 2018:
Payroll employment increases by 312,000 in December; unemployment rate rises to 3.9%
ADP® (Automatic Data Processing), for employment in December 2018:
U.S. adds most private-sector jobs in almost 2 years, says ADP
Bureau of Labor Statistics, for employment in November 2018:
Payroll employment increases by 155,000 in November; unemployment rate unchanged at 3.7%
ADP® (Automatic Data Processing), for employment in November 2018:
U.S. adds 179,000 private-sector jobs in November: ADP
Bureau of Labor Statistics, for employment in October 2018:
The U.S. economy added 250,000 jobs in October, unemployment stays at 3.7 percent
ADP® (Automatic Data Processing), for employment in October 2018:
ADP National Employment Report: Private Sector Employment Increased by 227,000 Jobs in October 2018:
Bureau of Labor Statistics, for employment in September 2018:
Unemployment rate declines to 3.7% in September; payroll employment increases by 134,000
ADP® (Automatic Data Processing), for employment in September 2018:
U.S. adds 230,000 private-sector jobs in September: ADP
Bureau of Labor Statistics, for employment in August 2018:
U.S. Added 201,000 Jobs in August; Unemployment Rate Steady at 3.9%
ADP® (Automatic Data Processing), for employment in August 2018:
U.S. Firms in August Added Fewest Workers in 10 Months, ADP Says
Bureau of Labor Statistics, for employment in July 2018:
Payroll employment increases by 157,000 in July; unemployment rate edges down to 3.9%
ADP® (Automatic Data Processing), for employment in July 2018:
ADP National Employment Report: Private Sector Employment Increased by 219,000 Jobs in July
Bureau of Labor Statistics, for employment in June 2018:
U.S. Added 213,000 Jobs in June; Unemployment Ticks Up to 4%
ADP® (Automatic Data Processing), for employment in June 2018:
ADP National Employment Report: Private Sector Employment Increased by 177,000 Jobs in June
Bureau of Labor Statistics, for employment in May 2018:
U.S. economy extends its hiring spree, with a better than expected 223,000 new jobs in May
ADP® (Automatic Data Processing), for employment in April 2018:
U.S. adds 204,000 private-sector jobs in April, ADP report shows
machoneman
(3,994 posts)the books. Hey, folks will only remember the high numbers and not the downward revisions, eh?

rogue emissary
(3,147 posts)Now that we have a white guy in the white house.
moose65
(3,166 posts)Remember during the Obama years when the conservatives always brought up the labor force participation rate? That was about the only negative thing they could find, and they crowed about it every month. Now, crickets about that!
And in regards to 103 straight months of job growth, THANKS OBAMA!!
rogue emissary
(3,147 posts)I just didn't think they'd be so hypocritical to now boast about the same numbers.

moose65
(3,166 posts)They are hypocritical about EVERYTHING 🙄
oldsoftie
(12,481 posts)We could have just as easily looked at the "true" unemployment numbers when Pres Obama was still in office, along with other more in-depth stats. But the main metrics everyone looks at are the ones that dont get too far into the weeds
Trump should have hoped for a slowdown last year to have time to recover.
I believe that slow down will materialize NEXT year, which HE will have to own, like he's owning these numbers. And its tough to win when the economy is sliding down!!

OldBaldy1701E
(5,076 posts)I have always been informed that they seldom have any kind of accurate account of those who have basically given up on working anywhere and doing anything because of various reasons. Have they finally figured out how to account for these Americans? I am very curious, as that fact alone would be such a strong indicator that they are lying out of their collective asses. I know this is a statistic that often goes unnoticed and therefore can't have any bearing in that number they are tossing about, yet these people represent a bigger faction of the population than most people want to admit...
mahatmakanejeeves
(57,260 posts)In April, 1.4 million persons were marginally attached to the labor force, little different from a year earlier. (Data are not seasonally adjusted.) These individuals were not in the labor force, wanted and were available for work, and had looked for a job sometime in the prior 12 months. They were not counted as unemployed because they had not searched for work in the 4 weeks preceding the survey. (See table A-16.)
Among the marginally attached, there were 454,000 discouraged workers in April, about unchanged from a year earlier. (Data are not seasonally adjusted.) Discouraged workers are persons not currently looking for work because they believe no jobs are available for them. The remaining 963,000 persons marginally attached to the labor force in April had not searched for work for reasons such as school attendance or family responsibilities. (See table A-16.)
roman1219
(2 posts)And yet when economic numbers are released, we accept their accuracy without question. Is it just possible that these numbers are fudged (trump said obama did it, so he might be doing it too). Will anybody question the accuracy of this economic information that is produced by an administration that is infected with pathological liars. Is there somebody who can verify these numbers. Liars lie, especially when they are worried, scared, and desperate. Just ask anybody who knows a pathological liar--they always lie--they won't tell the truth unless they absolutely have no other way out. Remember lying to the public is not a crime, lying under oath is...so if the department of labor says that the number is say...150,000 and trump doesn't like it, increases it to 263,000. is that a crime? It's a lie, but not a crime? And since trump obviously has no respect for the government or its legislative bodies, trump could care less as long as it "works". If the numbers are accurate and if they have been accurate all along, then good. But I suspect that this president, with his desperation to be "GREATEST OF ALL TIME", coupled with his penchant for lying and breaking the rules (if not the law), and his upcoming need to be reelected, he is more than capable of "fudging" the numbers. Then consider all the people around him like barr, McConnell, huckabee, conway, pence, graham, and a host of others who have jumped in the "rabbit hole" to support him. They have and will lie for him. They all share trump's hatred of the government and the Media. And the American people! The majority of us had jobs before he was elected into office, so we really can't tell by observation--especially since some of us had to pay higher taxes this year due to his tax cuts. So I'm not really excited about this so called good economic news.

marble falls
(56,956 posts)is mine to avenge; I will repay,”[a] says the Lord.
Romans 12:19 New International Version (NIV)
Who are you wanting to wait for G*d's wrath?
progree
(10,884 posts)Not In Labor Force: +646,000
I'm still going through the tables looking for aberrant statistics.
The Employed and the Labor Force numbers (and the headline unemployment rate) come from the Household Survey, which is a lot more volatile (much more statistical noise) than the much larger Establishment Survey that provides the headline payroll job number ( +263,000 in April ).
Anyway, I remember on the leadup to the 2012 election, Jack Welch, former CEO of GE and Romney suckass, was making an enormous hoo hah about a similar (and quite common situation) where the establishment survey and "employed" number went in opposite directions -- saying it was clear Obama was cooking the books etc. etc.
As for labor force dropping 490,000, that's a big reason unemployment rate dived from 3.9% to 3.6%. Traditionally, when the labor force drops, people write about how 490,000 gave up the job search because there were no jobs to be found, blah blah. Actually, this, and other Household Survey figures that are measured in the thousands of people -- bounce around like crazy month to month.
Over past 12 months, the labor force is up 919,000, which is just a 76,583/month average.
Oh another: Not In Labor Force jumped by 369,000 from February to March, and jumped another 646,000 from March to April. It is now at 96,223,000 .
Remember when Benedict Donald, during the campaign, made an enormous hoo hah about "94 million jobless Americans"? And used that as the basis to claim that the "true unemployment rate" was 40%? (He had many other estimates of that). Well anyway, we're up to 96 million "jobless Americans", Benedict.
Will post if I find any more of these.
ON EDIT: http://www.bls.gov/news.release/pdf/empsit.pdf has the whole enchilada on the latest job numbers. That's what I download each month and then look through the tables for certain key statistics.
BumRushDaShow
(128,269 posts) progree
(10,884 posts)I also know a number of data series numbers that show the monthly figures for decades --
e.g. Labor Force
http://data.bls.gov/timeseries/LNS11000000
Monthly changes in Labor Force
http://data.bls.gov/timeseries/LNS11000000?output_view=net_1mth
One way to find these is go through the URL in my sig line:
http://www.democraticunderground.com/111622439
and search for "timeseries"
==============================================
I've been through the tables, seems like I found all the aberrant statistics I'm going to find.
I may take a shot at calculating Paul Solman's an unemployment rate based on "all people who say they want a job, period" number -- the last calculation I did was 10.1% as the January 2019 number.
This was when the headline unemployment rate (U-3) was 4.0% and the U-6 underemployment rate (the broadest measure of unemployment, that includes part-time people wanting full-time jobs, and "marginally attached" workers) was 8.1%.
Now (today's report for April 2019) the latter two numbers are 3.6% and 7.3% respectively.
I'm a baby boomer and I voluntarily left the work force when I approached 70. Some of my friends in the same age range are telling me they've decided to stop working also.
How is that accounted for seeing as how we're the a very large number of people?
progree
(10,884 posts)Last edited Fri May 3, 2019, 12:51 PM - Edit history (1)
The headline unemployment rate (U-3) only counts people who are jobless, say they want a job, and have looked for work in the past 4 weeks.
The Labor Force (and Labor Force participation rate) is a count of the unemployed by the above definition, plus the Employed.
Everyone else is Not In The Labor Force (well this, and all of the above are non-institutionalized civilian population age 16+).
The broadest measure of unemployment rate that the BLS maintains is U-6, which counts everyone who says they want a job and has looked for work in the past 12 months. It includes people who have part-time work and say they want full-time work.
Some links from http://www.democraticunderground.com/111622439
# Unemployment rate http://data.bls.gov/timeseries/LNS14000000
# U-6 unemployment rate http://data.bls.gov/timeseries/LNS13327709
# NILF -- Not in Labor Forcehttp://data.bls.gov/timeseries/LNS15000000
# NILF-WJ -- Not in Labor Force, Wants Job http://data.bls.gov/timeseries/LNS15026639
# Part-Time Workers who want Full-Time Jobs (Table A-8's Part-Time For Economic Reasons) http://data.bls.gov/timeseries/LNS12032194
Unemployment rates, by ethnicity (white, Hispanic, black), age, and gender
http://www.bls.gov/news.release/empsit.t01.htm
http://www.bls.gov/news.release/empsit.t02.htm (race, then sex, some age)
http://www.bls.gov/news.release/empsit.t03.htm (continuation of t02.htm)
Unemployment rate: U1, U2, U3, U4, U5, U6 - Table A-15. Alternative measures of labor underutitlization
http://www.bls.gov/news.release/empsit.t15.htm
Definitions: http://www.bls.gov/lau/stalt.htm
See U-1 thru U-6 together, each line a different color (scroll down to Chart # 20 ): http://www.bls.gov/web/empsit/cps_charts.pdf
. # U-1, U-2: U-1 is http://data.bls.gov/timeseries/LNS13025670 and U-2 is http://data.bls.gov/timeseries/LNS14023621 if anyone cares
. # U-3 Unemployment rate, seasonally adjusted (this is the headline official unemployment rate number) http://data.bls.gov/timeseries/LNS14000000
. # U-4 Total unemployed plus discouraged workers, as a percent of the civalian labor force plus discouraged workers, seasonally adjusted http://data.bls.gov/timeseries/LNS13327707
. # U-5 Total unemployed, plus discouraged workers, plus all other marginally attached workers, as a percent of the civilian labor force plus all marginally attached workers, seasonally adjusted
http://data.bls.gov/timeseries/LNS13327708
. # U-6 Total unemployed, plus all marginally attached workers plus total employed part time for economic reasons, as a percent of all civilian labor force plus all marginally attached workers, seasonally adjusted. This is the BLS's broadest measure of unemployment. http://data.bls.gov/timeseries/LNS13327709
llmart
(15,527 posts)Say you're on unemployment and your unemployment runs out and you just decide to stop working or looking for work.
How do they know in these situations that you've decided to stop working voluntarily?
progree
(10,884 posts)As for unemployment benefit status -- the count of the unemployed and the unemployment rate is NOT a count of those receiving unemployment benefits, nor is unemployment benefit receiver status factored at all into any of the official national unemployment rate statistics.
You are unemployed if you say you don't have a job, say you want a job, and say you've looked for work in the last 4 weeks (they have more specific questions than that, e.g. looking for work means more than just looking through jobs listings). Regardless of whether you are receiving unemployment benefits or not.
There are other questions, but those are the main ones. You have to also be civilian, non-institutionalized, and age 16 or over.
See: http://www.bls.gov/cps/cps_htgm.htm (and search the page for the word "insurance" ) or Google the below line::
"How the Government Measures Unemployment" cps_htgm.htm
and search the page for the word "insurance"

sandensea
(21,589 posts)How? By cherry-picking the neighborhoods that are and aren't surveyed.
Newport Beach? Go for it!
Gary, IN? Catchy tune - but forget it.
at140
(6,110 posts)That 96,223,000 number is more significant by orders of magnitude than unemployment rate.
progree
(10,884 posts)People 16 and over going to school. Stay-at-home moms and dads by choice....
More significant to me is Not In Labor Force, Wants Job
http://data.bls.gov/timeseries/LNS15026639
5,121,000
+106,000 in the past month, and down just 22,000 over the last 12 months.
In February I calculated the Paul Solman "U-7" rate -- everyone who says they want a job, no matter how long it has been since they looked for work -- it came to 10.2%.
at140
(6,110 posts)Yes 16 year old's should be excluded from the cadre of unemployed.
And anyone collecting social security checks should be excluded. Those seniors
sometimes do work part time jobs, but if not working should not be counted as
unemployed.
The more accurate count of unemployed would be take all able bodied adults
age 19-65 (inclusive) and subtract how many of those adults are paying SS tax.
Because everyone with a job or business pays social security tax.
progree
(10,884 posts)It doesn't cut off at 65. Everyone between 16 and 160 is treated the same in these statistics.
Likewise the 96 million Not In Labor Force is everyone 16 and over (including centenarians) who isn't working a job and has not looked for work in the last 4 weeks, or tells the survey taker that they don't want a job now .
If a 16 year old is working, she/he is counted as Employed. If not working but says wants a job, says is able to take a job if offered, and has looked for work in the past 4 weeks, she is counted as unemployed.
Same for someone who is 35 or 160.
People that these Household Survey statistics count also must be civilian and non-institutionalized. If they are military or institutionalized (e.g. nursing home, prison), they are on a different planet as far as the BLS is concerned.
There are BLS series for different age groups (unemployment rate, labor force participation rate, employed, unemployed, labor force, population, and many more), including age 16-65, and age 65+. Also 25-34, 16-54, and many others.
I've known one self-employed person that was not paying SS tax (no, I'm not that person).
There's a gray economy where people work "off the books" and don't pay SS taxes and neither do their employers.
But counting the number of people paying SS taxes would be a good indicator to know -- probably that statistic is available somewhere, ...
Social Security does keep statistics on average and median wages, for example, http://www.ssa.gov/oact/cola/central.html
So if I googled hard enough, I might find something on the number paying SS taxes.
at140
(6,110 posts)progree
(10,884 posts)mahatmakanejeeves
(57,260 posts)Your talking point changed. The job-growth trend, not so much.
Link to tweet
The unemployment rate is low & that's great. Check out the trend you inherited & how it's changed. Progress so steady over so many years.
Link to tweet
This chicken can claim it is doing an awesome job driving because it inherited the wheel when momentum's going the right way.
When circumstances require more than squawking & preening, the truth will be clear.
Link to tweet
progree
(10,884 posts)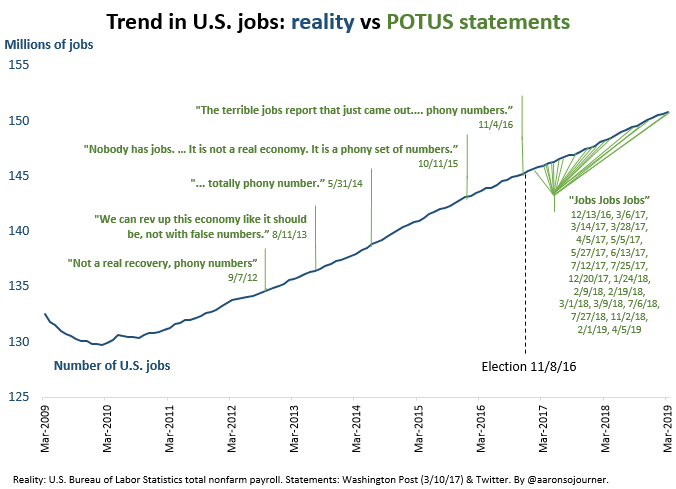
"Not a real recovery, phony numbers" 9/7/12
"We can rev up this economy like it should be, not with false numbers" 8/11/13
"... totally phony number." 5/31/14
"Nobody has jobs ... it is not a real economy. It is a phony set of numbers." 10/11/15
"The terrible jobs report that just came out... phony numbers" 11/4/16
EDITED: I stole BumRushDaShow's graphic in #40, since that is what I wanted to highlight. Thanks, BRDS!
BumRushDaShow
(128,269 posts)Under Obama, it was always "the economy is anemic" talking point.
Plus the graph in later tweets -
mahatmakanejeeves
(57,260 posts)From the BLS Twitter account:
More charts and analysis on the April nonfarm payroll employment numbers http://go.usa.gov/4UqY #JobsReport #BLSdata
Link to tweet
* * * * *
Understanding BLS Unemployment Statistics … #JobsReport #BLSdata
Link to tweet
* * * * *
See our interactive graphics on today’s #JobsReport http://go.usa.gov/cn5B4 #BLSdata #DataViz
Link to tweet
* * * * *
If you don't have the time to read anything else, read this. It is what the talking heads will recite on the TV news tonight. William J. Wiatrowski had been the Acting Commissioner through the release of the February report, on March 8, 2019, but BLS finally has a commissioner.
Commissioner's Statement on the Employment Situation
Advance copies of this statement are made available to the press
under lock-up conditions with the explicit understanding that
the data are embargoed until 8:30 a.m. Eastern Daylight Time.
Statement of
William W. Beach
Commissioner
Bureau of Labor Statistics
Friday, May 3, 2019
In April, nonfarm payroll employment increased by 263,000, and the unemployment rate declined to 3.6 percent. Over the month, notable job gains occurred in professional and business services, construction, health care, and social assistance.
The April employment gain compares with an average monthly gain of 213,000 over the prior 12 months. (The prior 12-month average incorporates revisions for February and March, which increased nonfarm payroll employment by 16,000 on net.)
Employment in professional and business services increased by 76,000 in April. Job gains occurred in administrative and support services (+53,000) and computer systems design and related services (+14,000). Over the past 12 months, professional and business services has added 535,000 jobs.
Construction employment rose by 33,000 in April, with gains occurring in nonresidential specialty trade contractors (+22,000) and in heavy and civil engineering construction (+10,000). Over the past 12 months, construction employment has increased by 256,000.
Employment in health care increased by 27,000 in April and 404,000 over the past 12 months. In April, job gains occurred in ambulatory health care services (+17,000), hospitals (+8,000), and community care facilities for the elderly (+7,000).
Social assistance added 26,000 jobs over the month, with all of the gain occurring in individual and family services. Over the past 12 months, employment in social assistance has increased by 120,000.
Employment continued to trend up in financial activities in April (+12,000). Over the past year, the industry has added 110,000 jobs.
In April, manufacturing employment changed little for the third month in a row (+4,000). In the 12 months prior to February, manufacturing had added an average of 22,000 jobs per month.
Retail trade employment changed little in April (-12,000). General merchandise stores lost 9,000 jobs, while motor vehicle and parts dealers added 8,000 jobs.
Employment in other major industries--including mining, wholesale trade, transportation and warehousing, information, leisure and hospitality, and government--showed little change over the month.
Average hourly earnings of all employees on private nonfarm payrolls rose by 6 cents in April to $27.77, following a 5-cent gain in March. Over the past 12 months, average hourly earnings have risen by 3.2 percent; the over-the-year percent change has been 3.0 percent or above for 9 consecutive months. From March 2018 to March 2019, the Consumer Price Index for All Urban Consumers (CPI-U) increased by 1.9 percent (on a seasonally adjusted basis).
Turning to measures from the survey of households, the unemployment rate declined by 0.2 percentage point to 3.6 percent in April, the lowest rate since December 1969. Over the month, the number of unemployed people fell by 387,000 to 5.8 million.
Among the unemployed, the number of people searching for work for 27 weeks or more was little changed at 1.2 million in April. These long-term unemployed accounted for 21.1 percent of the unemployed.
The labor force participation rate decreased by 0.2 percentage point to 62.8 percent in April but was unchanged from a year earlier. The employment-population ratio, at 60.6 percent, was unchanged over the month.
In April, 4.7 million people were working part time for economic reasons (also referred to as involuntary part-time workers), little changed from the previous month.
Among those neither working nor looking for work in April, 1.4 million were considered marginally attached to the labor force, little changed from a year earlier. (People who are marginally attached to the labor force had not looked for work in the 4 weeks prior to the survey but wanted a job, were available for work, and had looked for a job within the last 12 months.) Discouraged workers, a subset of the marginally attached who believed no jobs were available for them, numbered 454,000 in April, also little changed from a year earlier.
In summary, nonfarm payroll employment increased by 263,000 in April, and the unemployment rate declined to 3.6 percent.
* * * * *
It used to be that you could get free access to articles in The Wall Street Journal. by going in through TWSJ.'s Twitter account or the Twitter accounts of the authors:
For free access to articles in The Wall Street Journal., try going in through the authors' Twitter feeds:
This trick doesn't seem to work anymore, but you might be able to get in if they've slipped up. Here are those accounts:
* * * * *
The Wall Street Journal.: @WSJ
https://twitter.com/wsj
Wall Street Journal
Breaking news and features from the WSJ.
* * * * *
Ben Leubsdorf: @BenLeubsdorf
https://twitter.com/BenLeubsdorf
I cover the economy at @WSJ. @ConMonitorNews, @AP, @the_herald alum. DC native. Hyperactive news omnivore. Also I like burritos. ben.leubsdorf@wsj.com
* * * * *
Josh Zumbrun: @JoshZumbrun
https://twitter.com/JoshZumbrun
National economics correspondent for the Wall Street Journal. Covering the world's usual state of greed and disorder, confusion and apathy. josh.zumbrun@wsj.com
* * * * *
Nick Timiraos: @NickTimiraos
https://twitter.com/NickTimiraos
National economics correspondent, The Wall Street Journal
Please look at the tweets, as Nick Timiraos likes to slice and dice the data every which way. Also, link to the "11 charts " article from his Twitter feed to get past TWSJ.'s paywall.
* * * * *
Jeffrey Sparshott: @jeffsparshott
https://twitter.com/jeffsparshott
Jeffrey.Sparshott@wsj.com
* * * * *
Paul Vigna: @paulvigna
https://twitter.com/paulvigna
Markets, bitcoin, and the zombie apocalypse.
* * * * *
Eric Morath: @EricMorath
https://twitter.com/EricMorath
Eric.Morath@wsj.com
I'm a Wall Street Journal economy reporter, dad, husband and Spartan for life. eric.morath@wsj.com
Washington DC
blogs.wsj.com/economics/
* * * * *
Sarah Chaney: @sechaney
https://twitter.com/sechaney
Economy Reporter at The Wall Street Journal. Tar Heel. sarah.chaney@wsj.com
* * * * *


Bengus81
(6,927 posts)That does NOT happen in a tight job market. I can remember Mikey D's paying about that much to start when Clinton was President in 97-98 and the economy was truly booming.
NotHardly
(1,062 posts)progree
(10,884 posts)in the meantime
see: How the Government Measures Unemployment"
http://www.bls.gov/cps/cps_htgm.htm
There isn't double counting in the unemployment statistics. They call 60,000 households and ask about the employment status of household members. Nor in the Employed statistic of the Household Survey. But there is double counting in the headline non-farm payroll jobs number.
They don't count military, only non-institutional civilians age 16+
Have a part-time job? Congrats, you are employed in the headline unemployment statistic (U-3). But part-timers who say they want full time work are counted as unemployed in U-6 unemployment statistic.
A jobless person who has not looked for work in the past 4 weeks is not counted as unemployed in the headline (U-3) statistic. They are counted in the U-6 statistic if they have looked in the past 12 months. Beyond 12 months: not counted, except that "Not In Labor Force, Wants Job" includes them.

Blue_Tires
(55,445 posts)4.1% unemployment in Obama's last year was a national emergency according to the GOP 

JustFiveMoreMinutes
(2,133 posts)100,000 Senior White Collar Jobs will build a stronger 'tax base'.
100,000 Uber/Lyft/Amazon/Grubhub drivers.. hmmmmm.
progree
(10,884 posts)because it comes out at the same time as the jobs report.
I look at the hourly earnings Of production and nonsupervisory employees:
# Inflation-adjusted in 1982-1984 dollars https://data.bls.gov/timeseries/CES0500000032
# Not inflation-adjusted https://data.bls.gov/timeseries/CES0500000008
There is also a average weekly earnings versions of the above:
# inflation-adjusted weekly - http://data.bls.gov/timeseries/CES0500000031
# not inflation-adjusted weekly - http://data.bls.gov/timeseries/CES0500000030
I have lots of other income statistics links at
http://www.democraticunderground.com/111622439#post9
