Welcome to DU! The truly grassroots left-of-center political community where regular people, not algorithms, drive the discussions and set the standards. Join the community: Create a free account Support DU (and get rid of ads!): Become a Star Member Latest Breaking News General Discussion The DU Lounge All Forums Issue Forums Culture Forums Alliance Forums Region Forums Support Forums Help & Search
1 replies = new reply since forum marked as read
Highlight: NoneDon't highlight anything 5 newestHighlight 5 most recent replies
What This Chart Actually Means for COVID-19 (Original Post) Quixote1818 Mar 2020 OP
The problem with these charts kurtcagle Mar 2020 #1

kurtcagle

(1,602 posts)
1. The problem with these charts
Wed Mar 25, 2020, 11:42 PM
Mar 2020

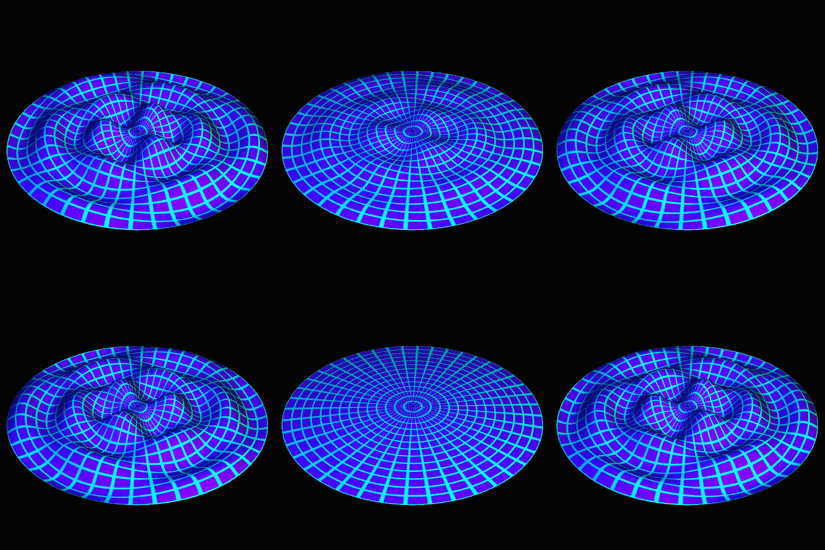
is that they assume a once and done profile, and I have a feeling that what we may end up seeing instead is a complex wave pattern such as that seen in Bessel functions:

?timestamp=1269381608151

That is to say, you'll see peaks all over the place, some high, some low, reinforcing because the virus takes repeated infections before the body establishes immunity.


Latest Discussions»Retired Forums»Video & Multimedia»What This Chart Actually ...