Welcome to DU!
The truly grassroots left-of-center political community where regular people, not algorithms, drive the discussions and set the standards.
Join the community:
Create a free account
Support DU (and get rid of ads!):
Become a Star Member
Latest Breaking News
General Discussion
The DU Lounge
All Forums
Issue Forums
Culture Forums
Alliance Forums
Region Forums
Support Forums
Help & Search
Economy
Related: About this forumWhat Happened to the Recovery?
from Dollars & Sense:
What Happened to the Recovery?
BY GERALD FRIEDMAN
Part I: Weak Employment, Stagnant Wages, and Booming Profits
The 2007-2010 recession was the longest and deepest since World War II. The subsequent recovery has been the weakest in the postwar period. While total employment has finally returned to its pre-recession level, millions remain out of work and annual output (GDP) is almost a trillion dollars below the economy’s “full-employment” capacity. This column explains how high levels of unemployment have held down wages, contributing to soaring corporate profits and a remarkable run-up in the stock market.
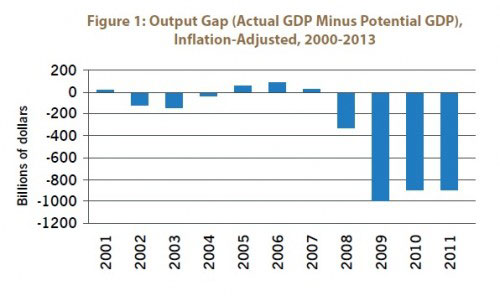
Output plunged and has not recovered. There was a sharp fall in output (GDP) at the onset of the Great Recession, down to 8% below what the economy could produce if labor and other resources were employed at normal levels (“full employment” capacity). Since the recovery began, output has grown at barely above the rate of growth in capacity, leaving the “output gap” at more than 6% of the economy’s potential—or nearly $1 trillion per year.
........(snip)........
Part II: Government Policy and Why the Recovery Has Been So Slow
The recovery from the Great Recession has been so slow because government policy has not addressed the underlying problem: the weakness of demand that restrained growth before the recession and that ultimately brought on a crisis. Focused on the dramatic events of fall 2008, including the collapse of Lehman Brothers, policymakers approached the Great Recession as a financial crisis and sought to minimize the effects of the meltdown on the real economy, mainly by providing liquidity to the banking sector. While monetary policy has focused on protecting the financial system, including protecting financial firms from the consequences of their own actions, government has done less to address the real causes of economic malaise: declining domestic investment and the lack of effective demand. Monetary policy has been unable to spark recovery because low interest rates have not been enough to encourage businesses and consumers to invest. Instead, we need a much more robust fiscal policy to stimulate a stronger recovery.
The Fed has kept interest rates unprecedentedly low. Determined not to repeat what orthodox economists saw as the main cause of the Great Depression—a “tight” money supply—the Federal Reserve responded very aggressively to the crisis in 2007 and 2008. The Fed drove its main target short-term interest rate, the federal funds rate, down to an unprecedented near-zero level. Even at interest rates below zero in real (inflation-adjusted) terms, however, effective demand has been so depressed and so much unused productive capacity has remained that banks have found few borrowers. .............(more)
The complete piece is at: http://www.dollarsandsense.org/archives/2014/0814friedman.html
InfoView thread info, including edit history
TrashPut this thread in your Trash Can (My DU » Trash Can)
BookmarkAdd this thread to your Bookmarks (My DU » Bookmarks)
7 replies, 1298 views
ShareGet links to this post and/or share on social media
AlertAlert this post for a rule violation
PowersThere are no powers you can use on this post
EditCannot edit other people's posts
ReplyReply to this post
EditCannot edit other people's posts
Rec (12)
ReplyReply to this post
7 replies
 = new reply since forum marked as read
Highlight:
NoneDon't highlight anything
5 newestHighlight 5 most recent replies
= new reply since forum marked as read
Highlight:
NoneDon't highlight anything
5 newestHighlight 5 most recent replies
= new reply since forum marked as read
Highlight:
NoneDon't highlight anything
5 newestHighlight 5 most recent replies
What Happened to the Recovery? (Original Post)
marmar
Aug 2014
OP

littlemissmartypants
(22,631 posts)1. What recovery. eom
FiveGoodMen
(20,018 posts)2. It went exactly as planned.
The Rich got all the money.

Tuesday Afternoon
(56,912 posts)5. yep.
Doctor_J
(36,392 posts)6. have to be pretty dim not to see through that
But many refuse to face the truth
Demeter
(85,373 posts)3. The Elite decreed: This Time It Will Be Different!
We won't do what every other government facing economic collapse has done. We won't support the People, the Economy, the Infrastructure.
We will play stupid money games between ourselves and let the rest go hang. The Poor are doing just fine without money...they don't need any of ours.
We will play stupid money games between ourselves and let the rest go hang. The Poor are doing just fine without money...they don't need any of ours.
We shall see who ends up hanging, won't we?

msongs
(67,394 posts)4. top 1%+ and their political stooges are doing just fine, thanks. nt

progree
(10,901 posts)7. What happened to 2012 and 2013 on the Figure 1 graph?
The Figure 1 graph in the OP (and in the dollars and sense article http://www.dollarsandsense.org/archives/2014/0814friedman.html ) has the title "Output Gap ... 2000-2013" but the last two bars on the bar chart are 2010 and 2011.
The source of this, per notes at the very bottom of the dollarsandsense article, is supposedly stateofworkingamerica.org -- I did a search and found this ( http://stateofworkingamerica.org/charts/output-gap-real-gdp-compared-to-potential-gdp-2000-11/ ):
http://stateofworkingamerica.org/m/?src= &w=640
The two graphs are of essentially the same thing, just presented differently (and with the 2nd graph including 2012 and 2013-Q1).
The first graph is a bar chart showing the difference between real GDP and potential GDP
The second graph has two lines: real GDP and potential GDP. But one can eyeball the difference between the two lines and see that the difference apparently matches the first graph (up thru 2011).
Anyway, it shows the gap closing just a little bit in 2012 and 2013, but, sadly, only just a little bit. Oh, oh well. Well, at least it's not getting worse.
In case anyone was wondering.
By the way, the dollarsandsense.org article in the OP (and the top of this posting) is worth scrolling through just to look at the several graphs