Economy
Related: About this forumSTOCK MARKET WATCH -- Thursday, 3 September 2015
[font size=3]STOCK MARKET WATCH, Thursday, 3 September 2015[font color=black][/font]
SMW for 2 September 2015
AT THE CLOSING BELL ON 2 September 2015
[center][font color=green]
Dow Jones 16,351.38 +293.03 (1.82%)
S&P 500 1,948.86 +35.01 (1.83%)
Nasdaq 4,749.98 +113.87 (2.46%)
[font color=red]10 Year 2.18% +0.01 (0.46%)
30 Year 2.95% +0.01 (0.34%) (0.00%) [font color=black]
[center][/font]
[HR width=85%]
[font size=2]Market Conditions During Trading Hours[/font]
[center]
(click on link for latest updates)
Market Updates
[/center]
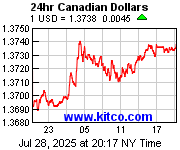
[font size=2]Euro, Yen, Loonie, Silver and Gold[center]


[/center]

[/center]
[HR width=95%]
[font color=black][font size=2]Handy Links - Market Data and News:[/font][/font]
[center]
Economic Calendar
Marketwatch Data
Bloomberg Economic News
Yahoo Finance
Google Finance
Bank Tracker
Credit Union Tracker
Daily Job Cuts
[/center]
[font color=black][font size=2]Handy Links - Economic Blogs:[/font][/font]
[center]
The Big Picture
Financial Sense
Calculated Risk
Naked Capitalism
Credit Writedowns
Brad DeLong
Bonddad
Atrios
goldmansachs666
The Stand-Up Economist
The Automatic Earth
Wall Street on Parade
[/center]
[font color=black][font size=2]Handy Links - Essential Reading:[/font][/font]
[center]
Matt Taibi: Secret and Lies of the Bailout
[/center]
[font color=black][font size=2]Handy Links - Government Issues:[/font][/font]
[center]
LegitGov
Open Government
Earmark Database
USA spending.gov
[/center][font color=black][font size=2]Handy Links - Videos:[/font][/font]
[center]
Charlie Rose talks with Roubini
Charlie Rose talks with Krugman
William Black: This Economic Disaster
Bill Moyers with Kevin Drum and David Corn
[/center]
[div]
[font color=red]Partial List of Financial Sector Officials Convicted since 1/20/09 [/font][font color=red]
2/2/12 David Higgs and Salmaan Siddiqui, Credit Suisse, plead guilty to conspiracy involving valuation of MBS
3/6/12 Allen Stanford, former Caribbean billionaire and general schmuck, convicted on 13 of 14 counts in $2.2B Ponzi scheme, faces 20+ years in prison
6/4/12 Matthew Kluger, lawyer, sentenced to 12 years in prison, along with co-conspirator stock trader Garrett Bauer (9 years) and co-conspirator Kenneth Robinson (not yet sentenced) for 17 year insider trading scheme.
6/14/12 Allen Stanford sentenced to 110 years without parole.
6/15/12 Rajat Gupta, former Goldman Sachs director, found guilty of insider trading. Could face a decade in prison when sentenced later this year.
6/22/12 Timothy S. Durham, 49, former CEO of Fair Financial Company, convicted of one count conspiracy to commit wire and securities fraud, 10 counts of wire fraud, and one count of securities fraud.
6/22/12 James F. Cochran, 56, former chairman of the board of Fair, convicted of one count of conspiracy to commit wire and securities fraud, one count of securities fraud, and six counts of wire fraud.
6/22/12 Rick D. Snow, 48, former CFO of Fair, convicted of one count of conspiracy to commit wire and securities fraud, one count of securities fraud, and three counts of wire fraud.
7/13/12 Russell Wassendorf Sr., CEO of collapsed brokerage firm Peregrine Financial Group Inc. arrested and charged with lying to regulators after admitting to authorities he embezzled "millions of dollars" and forged bank statements for "nearly twenty years."
8/22/12 Doug Whitman, Whitman Capital LLC hedge fund founder, convicted of insider trading following a trial in which he spent more than two days on the stand telling jurors he was innocent
10/26/12 UPDATE: Former Goldman Sachs director Rajat Gupta sentenced to two years in federal prison. He will, of course, appeal. . .
11/20/12 Hedge fund manager Matthew Martoma charged with insider trading at SAC Capital Advisors, and prosecutors are looking at Martoma's boss, Steven Cohen, for possible involvement.
02/14/13 Gilbert Lopez, former chief accounting officer of Stanford Financial Group, and former controller Mark Kuhrt sentenced to 20 yrs in prison for their roles in Allen Sanford's $7.2 billion Ponzi scheme.
03/29/13 Michael Sternberg, portfolio mgr at SAC Capital, arrested in NYC, charged with conspiracy and securities fraud. Pled not guilty and freed on $3m bail.
04/04/13 Matthew Marshall Taylor,fmr Goldman Sachs trader arrested, charged by CFTC w/defrauding his employer on $8BN futures bet "by intentionally concealing the true huge size, as well as the risk and potential profits or losses associated."
04/04/13 Matthew Taylor admits guilt, makes plea bargain. Sentencing set for 26 June; faces up to 20 years in prison but will likely only see 3-4 years. Says, "I am truly sorry."
04/11/13 Ex-KPMG LLP partner Scott London charged by federal prosecutors w/passing inside tips to a friend in exchange for cash, jewelry, and concert tickets; expected to plead guilty in May.
08/01/13 Fabrice Tourré convicted on six counts of security fraud, including "aiding and abetting" his former employer, Goldman Sachs
08/14/13 Javier Martin-Artajo and Julien Grout charged with wire fraud, falsifying records, and conspiracy in connection with JP Morgan's "London Whale" trade.
08/19/13 Phillip A. Falcone, manager of hedge fund Harbinger Capital Partners, agrees to admit to "wrongdoing" in market manipulation. Will banned from securities industry for 5 years and pay $18MM in disgorgement and fines.
09/16/13 Javier Martin-Artajo and Julien Grout officially indicted on charges associated with "London Whale" trade.
02/06/14 Matthew Martoma convicted of insider trading while at hedge fund SAC (Stephen A. Cohen) Capital Advisors. Expected sentence 7-10 years.
03/24/14 Annette Bongiorno, Bernard Madoff's secretary; Daniel Bonventre, director of operations for investments; JoAnn Crupi, an account manager; and Jerome O'Hara and George Perez, both computer programmers convicted of conspiracy to defraud clients, securities fraud, and falsifying the books and records.
05/19/14 Credit Suisse, which has an investment bank branch in NYC, agrees to plead guilty and pay appx. $2.6 billion penalties for helping wealthy Americans hide wealth and avoid taxes.
09/08/14 Matthew Martoma, convicted SAC trader, sentenced to 9 years in prison plus forfeiture of $9.3 million, including home and bank accounts
08/03/15 Former City (London) trader Tom Hayes found guilty of rigging global Libor interest rates. Each fo eight counts carries up to 10 yr. sentence.
08/21/15 Charles Antonucci Sr, former pres. Park Ave. Bank sentenced to 2.5 years in prison for bribery, fraud, embezzlement, and attempt to steal $11MM in TARP bailout funds, as well as $37.5MM fraud on OK insurance company. To pay $54MM in restitution and give up additional $11MM.
[HR width=95%]
[center]

[font size=3][font color=red]This thread contains opinions and observations. Individuals may post their experiences, inferences and opinions on this thread. However, it should not be construed as advice. It is unethical (and probably illegal) for financial recommendations to be given here.[/font][/font][/font color=red][font color=black]
 = new reply since forum marked as read
Highlight:
NoneDon't highlight anything
5 newestHighlight 5 most recent replies
= new reply since forum marked as read
Highlight:
NoneDon't highlight anything
5 newestHighlight 5 most recent replies
Demeter
(85,373 posts)Gets to the point, without being ugly.
It's hot. It's sticky. We had a 10 minute thunderstorm this morning, and it didn't do anything except increase the humidity.
But I only found one peach down, Wednesday. Either people are walking off with them, or the tree has decided how many it's willing to hold to perfect ripeness. I got enough for another pie...just no time!
I'm picking pears and apples off trees in the common area...not sure what I'm going to do with them, but they aren't anywhere near over ripe yet.
I'm truly thinking of throwing in the towel and going farmer. I think I'm in love.

MattSh
(3,714 posts)2 Google Translations from Russian...
8:41 this morning, September 3, Kiev was shrouded in acrid smoke. The smell is felt in all areas of the capital. The reason - the fires, which began last September 2. Therefore, the local authorities decided to reduce the school day in schools, and tomorrow, September 4, suspend the teaching process in general. In addition, the Kyiv City State Administration requested not to leave the house without much need. Now experts are trying to spend a few operational measures to reduce the content of harmful substances in the air: there watering the streets and yards in emergency mode, the entry is limited to major transport to the capital. Also in the KSCA asked not to use private cars today.
Specialists asked the residents of Kiev to close the windows, ventilate the room in the evening and at night, to limit children walking in the street, and if necessary, use a moist dressings for respiratory protection, and not to go out unless absolutely necessary.
Complete story at - http://kiev.vgorode.ua/news/sobytyia/268372-kyev-v-edkom-dymu-shkoly-zakryvauit-luidei-prosiat-sydet-doma
AND THIS...
Weather in Kiev: September has temperature records - in the city
Summer this year in Kiev, has become one of the hottest on record.
According to the observations of the weather station of the Central Geophysical Observatory, the average summer temperature was 21.6 degrees Celsius. This is almost 3 degrees above normal. Thus, this summer was the second hottest summer since 2010, starting from 1881.
All three months were very scarce on rain in August generally fell only 4% laid norms. So this summer, and was even the driest of 125 years of observation. (Ukraine, with all it's problems, gets another one).
New records
During the three summer months there were 6 temperature records.
September continues to surprise high temperature: this night was recorded highest since 1881 the temperature - 22 degrees of heat. Day had to be broken another record: this will be known later.
Complete story at - http://kiev.vgorode.ua/news/sobytyia/268344-kohda-pokholodaet-eto-leto-v-kyeve-stalo-odnym-yz-samykh-zharkykh-za-vsui-ystoryui
High 90's yesterday, around 90 today. But we do have AC so we can keep the smoke out. But at least the fires are not in the Chernobyl Exclusion Zone.
Demeter
(85,373 posts)Watch the 1% fly in on copters and sea planes, to meet margin calls...

DemReadingDU
(16,000 posts)Everyone pay attention!
Demeter
(85,373 posts)Scientists have already calculated how many fish there are in the sea (230,000 species), and how many species there are on the planet overall (8.7m). Now they have had a crack at counting all of the world’s trees.
Using a combination of satellite and ground measurements, researchers estimated that there are just over 3tn trees on the planet, over seven times as many as the current, non peer-reviewed reckoning that relied on satellite images alone.
But people are having an “overwhelming” impact on the world’s forests, according to the international team from 15 countries. Human activities have led to the loss of nearly half the world’s trees (45.8%), the study found.
Today, people are responsible for the loss of around 15bn trees a year due to deforestation and demand for farmland, a figure that the authors said was “considerably higher” than just a century ago.
GRAPHS AND MORE DETAIL AT LINK...
Demeter
(85,373 posts)Experts warn that the G20's massive infrastructure plan will cause "rapid ecological deterioration."
THAT HAS GOT TO BE A PEN NAME...AND FAR TOO CLEVER...READ THE ARTICLE AT LINK
Demeter
(85,373 posts)Greece lifted a short-selling ban on equity derivatives on Tuesday, but extended the restriction on underlying shares for a month until the end of September, saying market conditions had improved but had not yet fully returned to normal.
The short-selling ban went into effect when Athens imposed capital controls on June 29 and had been extended until the end of August. A regulatory source had told Reuters on Monday the securities watchdog was considering lifting the ban.
"There is a partial lift, just for derivatives but not for the underlying stocks," said Xenophon Avlonitis, a vice-president at the Capital Market Commission, the country's securities regulator.
"The board considered that market conditions have not yet fully normalised and that there is still significant volatility. But we can always lift the ban before it expires," Avlonitis said, adding the move had the approval of the European Securities Markets Authority (ESMA).
The regulator's decision removes a restriction that prevented traders from short-selling derivatives, such as futures and options, on individual stocks and indexes on the Athens exchange.
Demeter
(85,373 posts)http://www.voxeu.org/article/leveraged-bubbles
CONCLUSION
...not all bubbles are created equal. When credit growth fuels asset price bubbles, the dangers for the financial sector and the real economy are much more substantial. The damage done to the economy by the bursting of credit boom bubbles is significant and long lasting.
In the past decades, central banks typically have taken a hands-off approach to asset price bubbles and credit booms. This way of thinking has been criticised by some institutions, such as the BIS, that took a less rosy view of the self-equilibrating tendencies of financial markets and warned of the potentially grave consequences of leveraged asset price bubbles. The findings presented here can inform ongoing efforts to devise better macro-financial theory and real-world applications at a time when policymakers are still searching for new approaches in the aftermath of the Great Recession.
DETAILS AT LINK
Demeter
(85,373 posts)BUT OF COURSE, THEY WOULD SAY THAT...OTHERWISE, THEY ARE MISERABLE FAILURES! "Quis custodiet ipsos custodes?"
http://finance.yahoo.com/news/comes-beige-book-172629617.html
The Beige Book is a collection of anecdotal economic observations from each of the Fed's 12 regions.
And all in all, Wednesday's latest report showed that things in the economy are more or less status quo, epxnaind as they were in the Fed's prior report.
The Beige Book is published two weeks before each Fed policy announcement and forms some of the basis for discussion about the economy at the two-day Federal Open Market Committee meeting.
Wednesday's report, however, only runs through August 24, and while some of the stock market volatility seen earlier in the month was captured by this report, the last couple weeks' chaos hadn't yet been seen....
THERE'S ALWAYS A LOOPHOLE, ISN'T THERE?
Demeter
(85,373 posts)The great global monetary tightening of 2015 is under way, but it’s not being led by the Federal Reserve.
Even as U.S. policy makers ponder whether to raise interest rates this month, one recent source of central bank liquidity in financial markets is drying up and the loss of it partly explains August’s trading volatility.
Behind the drawdown are the foreign exchange reserves run by the central banks. Bolstered following financial crises in the late 1990s as a buffer against capital outflows and falling currencies, such hoards fell to $11.43 trillion in the first quarter from a peak of $11.98 trillion in the middle of last year, according to the International Monetary Fund....
MORE AT LINK
Demeter
(85,373 posts)HE POSITS THE EVOLUTION OF HUMAN CULTURE IS UNDERFOOT--THOUGH, HE DOESN'T CALL IT THAT
http://www.bloombergview.com/articles/2015-08-31/maybe-this-global-slowdown-is-different
Demeter
(85,373 posts)“Look at the employment ratio; look at Andy Levin’s all-in slack measure (I’ll post something on this later)—they’re still signaling a job market that is unquestionably improving but is still far from full employment.”
In this post, we briefly explain some of the evidence that there’s far more labor market slack than is apparent from the unemployment rate alone. The unemployment rate doesn’t capture workers who, because of a difficult job market, have stopped looking for work. The labor force participation rate – the share of the population that is either working or actively looking for work – dropped off sharply during the recession, from about 66 percent to about 63 percent. While some of those folks left for retirement, others–maybe a third to a half by some measures–can be enticed back into a more welcoming job market.
A number of prime-age workers (those between age 25 and age 54), for example, have dropped out of the picture. The figure below shows the employment-to-population ratio for workers in this age group. Notice the five-percentage-point plunge it took during the recession; while it has nudged back up to just over 77 percent, it is still three percentage points beneath its pre-recession level.

Source: BLS
The “total employment gap,” developed by economist Andy Levin, is another indicator of the amount of labor market slack. The total employment gap accounts for three populations of potential workers: the unemployed (who are actively looking for jobs), those who have left the labor force but could potentially come back into it, and the number of workers with a part-time job who would rather have a full-time position. Using high-end estimates of the “natural” number of workers in each category (see data note below), we estimate that the total employment gap is at least 2.4 percentage points.

Source: Our estimate of Levin’s gap measure.
It is therefore unsurprising that we’ve yet to see much in the way of wage growth–while the job market is steadily improving, we aren’t yet at full employment. It is essential that policymakers keep these broader measures of labor slack in mind.
Data Note: The Levin gap measure relies on estimates of the size of the “potential” labor force and the “natural rate” of unemployment from the Congressional Budget Office, as well as an estimate, based on the pre-recession trend, of the “natural” number of full-time-equivalent involuntary part-time workers.
Demeter
(85,373 posts)Both the stock market and oil prices have been plunging. Is this “just another cycle,” or is it something much worse? I think it is something much worse. Back in January, I wrote a post called "Oil and the Economy: Where are We Headed in 2015-16?" In it, I said that persistent very low prices could be a sign that we are reaching limits of a finite world. In fact, the scenario that is playing out matches up with what I expected to happen in my January post. In that post, I said
The amount consumers can afford for oil
The cost of oil, if oil price matches the cost of production
This mismatch between rising costs of oil production and stagnating wages is what has been happening. The unaffordability problem can be hidden by a rising amount of debt for a while (since adding cheap debt helps make unaffordable big items seem affordable), but this scheme cannot go on forever.
Eventually, even at near zero interest rates, the amount of debt becomes too high, relative to income. Governments become afraid of adding more debt. Young people find student loans so burdensome that they put off buying homes and cars. The economic “pump” that used to result from rising wages and rising debt slows, slowing the growth of the world economy. With slow economic growth comes low demand for commodities that are used to make homes, cars, factories, and other goods. This slow economic growth is what brings the persistent trend toward low commodity prices experienced in recent years.
AND THERE'S STILL MORE "GOOD NEWS" AT LINK
Demeter
(85,373 posts)1. The big thing that is happening is that the world financial system is likely to collapse. Back in 2008, the world financial system almost collapsed. This time, our chances of avoiding collapse are very slim.
2. Without the financial system, pretty much nothing else works: the oil extraction system, the electricity delivery system, the pension system, the ability of the stock market to hold its value. The change we are encountering is similar to losing the operating system on a computer, or unplugging a refrigerator from the wall.
3. We don’t know how fast things will unravel, but things are likely to be quite different in as short a time as a year. World financial leaders are likely to “pull out the stops,” trying to keep things together. A big part of our problem is too much debt. This is hard to fix, because reducing debt reduces demand and makes commodity prices fall further. With low prices, production of commodities is likely to fall. For example, food production using fossil fuel inputs is likely to greatly decline over time, as is oil, gas, and coal production.
4. The electricity system, as delivered by the grid, is likely to fail in approximately the same timeframe as our oil-based system. Nothing will fail overnight, but it seems highly unlikely that electricity will outlast oil by more than a year or two. All systems are dependent on the financial system. If the oil system cannot pay its workers and get replacement parts because of a collapse in the financial system, the same is likely to be true of the electrical grid system.
5. Our economy is a self-organized networked system that continuously dissipates energy, known in physics as a dissipative structure. Other examples of dissipative structures include all plants and animals (including humans) and hurricanes. All of these grow from small beginnings, gradually plateau in size, and eventually collapse and die. We know of a huge number of prior civilizations that have collapsed.
This appears to have happened when the return on human labor has fallen too low. This is much like the after-tax wages of non-elite workers falling too low. Wages reflect not only the workers’ own energy (gained from eating food), but any supplemental energy used, such as from draft animals, wind-powered boats, or electricity. Falling median wages, especially of young people, are one of the indications that our economy is headed toward collapse, just like the other economies.
6. The reason that collapse happens quickly has to do with debt and derivatives. Our networked economy requires debt in order to extract fossil fuels from the ground and to create renewable energy sources, for several reasons: (a) Producers don’t have to save up as much money in advance, (b) Middle-men making products that use energy products (such cars and refrigerators) can “finance” their factories, so they don’t have to save up as much, (c) Consumers can afford to buy “big-ticket” items like homes and cars, with the use of plans that allow monthly payments, so they don’t have to save up as much, and (d) Most importantly, debt helps raise the price of commodities of all sorts (including oil and electricity), because it allows more customers to afford products that use them.
Demeter
(85,373 posts)1. Today’s general level of understanding about how the economy works, and energy’s relationship to the economy, is dismally low. Economics has generally denied that energy has more than a very indirect relationship to the economy. Since 1800, world population has grown from 1 billion to more than 7 billion, thanks to the use of fossil fuels for increased food production and medicines, among other things. Yet environmentalists often believe that the world economy can somehow continue as today, without fossil fuels. There is a possibility that with a financial crash, we will need to start over, with new local economies based on the use of local resources. In such a scenario, it is doubtful that we can maintain a world population of even 1 billion.
2. Economics modeling is based on observations of how the economy worked when we were far from limits of a finite world. The indications from this modeling are not at all generalizable to the situation when we are reaching limits of a finite world. The expectation of economists, based on past situations, is that prices will rise when there is scarcity. This expectation is completely wrong when the basic problem is lack of adequate wages for non-elite workers. When the problem is a lack of wages, workers find it impossible to purchase high-priced goods like homes, cars, and refrigerators. All of these products are created using commodities, so a lack of adequate wages tends to “feed back” through the system as low commodity prices. This is exactly the opposite of what standard economic models predict.
3. M. King Hubbert’s “peak oil” analysis provided a best-case scenario that was clearly unrealistic, but it was taken literally by his followers. One of Hubbert’s sources of optimism was to assume that another energy product, such as nuclear, would arise in huge quantity, prior to the time when a decline in fossil fuels would become a problem....
4. The world economy operates on energy flows in a given year, even though most analysts today are accustomed to thinking on a discounted cash flow basis. You and I eat food that was grown very recently. A model of food potentially available in the future is interesting, but it doesn’t satisfy our need for food when we are hungry.
Similarly, our vehicles run on oil that has recently been extracted; our electrical system operates on electricity that has been produced, essentially simultaneously. The very close relationship in time between production and consumption of energy products is in sharp contrast to the way the financial system works. It makes promises, such as the availability of bank deposits, the amounts of pension payments, and the continuing value of corporate stocks, far out into the future.
When these promises are made, there is no check made that goods and services will actually be available to repay these promises. We end up with a system that has promised very many more goods and services in the future than the real world will actually be able to produce. A break is inevitable; it looks like the break will be happening in the near future.
5. Changes in the financial system have huge potential to disrupt the operation of the energy flow system. Demand in a given year comes from a combination of (wages and other income streams in a given year) plus the (change in debt in a given year). Historically, the (change in debt) has been positive. This has helped raise commodity prices. As soon as we start getting large defaults on debt, the (change in debt) component turns negative, and tends to bring down the price of commodities. (Note Point 6 in the previous section.) Once this happens, it is virtually impossible to keep prices up high enough to extract oil, coal and natural gas. This is a major reason why the system tends to crash.
6. Researchers are expected to follow in the steps of researchers before them, rather than starting from a basic understudying of the whole problem. Trying to understand the whole problem, rather than simply trying to look at a small segment of a problem is difficult, especially if a researcher is expected to churn out a large number of peer reviewed academic articles each year. Unfortunately, there is a huge amount of research that might have seemed correct when it was written, but which is really wrong, if viewed through a broader lens. Churning out a high volume of articles based on past research tends to simply repeat past errors. This problem is hard to correct, because the field of energy and the economy cuts across many areas of study. It is hard for anyone to understand the full picture.
7. In the area of energy and the economy, it is very tempting to tell people what they want to hear. If a researcher doesn’t understand how the system of energy and the economy works, and needs to guess, the guesses that are most likely to be favorably received when it comes time for publication are the ones that say, “All is well. Innovation will save the day.” Or, “Substitution will save the day.” This tends to bias research toward saying, “All is well.” The availability of financial grants on topics that appear hopeful adds to this effect.
8. Energy Returned on Energy Investment (EROEI) analysis doesn’t really get to the point of today’s problems. Many people have high hopes for EROEI analysis, and indeed, it does make some progress in figuring out what is happening. But it misses many important points. One of them is that there are many different kinds of EROEI. The kind that matters, in terms of keeping the economy from collapsing, is the return on human labor. This type of EROEI is equivalent to after-tax wages of non-elite workers. This kind of return tends to drop too low if the total quantity of energy being used to leverage human labor is too low. We would expect a drop to occur in the quantity of energy used, if energy prices are too high, or if the quantity of energy products available is restricted.
9. Instead of looking at wages of workers, most EROEI analyses consider returns on fossil fuel energy–something that is at least part of the puzzle, but is far from the whole picture. Returns on fossil fuel energy can be done either on a cash flow (energy flow) basis or on a “model” basis, similar to discounted cash flow. The two are not at all equivalent. What the economy needs is cash flow energy now, not modeled energy production in the future. Cash flow analyses probably need to be performed on an industry-wide basis; direct and indirect inputs in a given calendar year would be compared with energy outputs in the same calendar year. Man-made renewables will tend to do badly in such analyses, because considerable energy is used in making them, but the energy provided is primarily modeled future energy production, assuming that the current economy can continue to operate as today–something that seems increasingly unlikely.
10. If we are headed for a near term sharp break in the economy, there is no point in trying to add man-made renewables to the electric grid. The whole point of adding man-made renewables is to try to keep what we have today longer. But if the system is collapsing, the whole plan is futile. We end up extracting more coal and oil today, in order to add wind or solar PV to what will soon become a useless grid electric system. The grid system will not last long, because we cannot pay workers and we cannot maintain the grid without a financial system. So if we add man-made renewables, most of what we get is their short-term disadvantages, with few of their hoped-for long-term advantages.
AND THEN, THERE'S THE CONCLUSIONS/PREDICTIONS
Demeter
(85,373 posts)- Increased debt defaults. Increased debt defaults of many kinds can be expected, including (a) Businesses involved with oil extraction suffering from low prices (b) Laid off oil workers not able to pay their mortgages, (c) Debt repayable in US dollars from emerging markets, including Russia, Brazil, and South Africa, because with their currencies now very low relative to the US dollar, debt is difficult to repay (d) Chinese debt related to overbuilding there, and (e) Debt of failing economies, such as Greece and Venezuela.
- Rising interest rates. With defaults rising, interest rates can be expected to rise, so that those making the loans will be compensated for the rising risk of default. In fact, this is already happening with junk-rated oil loans. Furthermore, it is possible that the US Federal Reserve will raise target interest rates in 2015. This possibility has been mentioned for several months, as part of normalizing interest rates.
- Rising unemployment. We know that nearly all of the increased employment since 2008 in the US took place in states with shale oil and gas production. As these programs are cut back, US employment is likely to fall. The UK and Norway are likely to experience drops in employment related to oil production, as their oil programs are cut. Countries of South America and Africa dependent on commodity exports are likely to see their employment cut back as well.
- Increased recession. The combination of rising interest rates and rising unemployment will almost certainly lead to recession. At first, some of the effects may be offset by the impact of lower oil prices, but eventually recessionary effects will predominate. Eventually, broken supply chains may become a problem, if companies with poor credit ratings cannot get financing they need at reasonable rates.
- Decreased oil supply, starting perhaps in late 2015. The timing is not certain. Businesses are likely to continue extraction where wells are already in operation, since most costs have already been paid. Also, some businesses have purchased price protection in the derivative market. They will likely continue drilling.
- Disruptions in oil exporting countries, such as Venezuela, Russia, and Nigeria. Oil exporters generally get the majority of their government revenue from taxes on oil. If oil prices remain low, oil-related tax revenue will drop greatly, necessitating cutbacks in food subsidies and other programs. Some countries may experience overthrows of existing governments and a sharp drop in oil exports. Central governments may even disband, as happened with the Soviet Union in 1991.
- Defaults on derivatives, because of sharp and long-lasting changes in oil prices, interest rates, and currency relativities. Securitized debt may also be at risk of default.
- Continued low oil prices, except for brief spikes, because of high interest rates, recession, and low “demand” (really affordability) for oil.
- Drop in stock market prices. Governments have been able to “pump up” stock market prices with their QE programs since 2008. At some point, though, higher interest rates may draw investors away from the stock market. Stock prices may also decline reflecting the poor prospects of the economy, with rising unemployment and fewer goods being manufactured.
- Drop in market value of bonds. When interest rates rise, the market value of existing bonds falls. Bonds are also likely to experience higher default rates. The combined effect is likely to lead to a drop in the equity of financial institutions. At least at first, this effect is likely to occur mostly outside the US, because the “flight to security” will tend to raise the level of the US dollar and lower US interest rates.
- Changes in international associations. Already, there is discussion of Greece dropping out of the Eurozone. Associations such as the European Union and the International Monetary Fund will find it increasingly difficult to handle problems, as their rich countries become poorer, and as loan defaults become increasing problems.
In total, eventually we are likely to experience a much worse situation than we did in the 2007-2009 period, although this may not be evident at first. It will be only over a period of time, after some of the initial “dominoes fall” that we will see what is really happening. Initially, economies of oil importing countries may appear to be doing fairly well, thanks to low oil prices. It will be later that the adverse impacts begin to take over, and eventually dominate.
Demeter
(85,373 posts)STUDY HER ARTICLES CAREFULLY....
My name is Gail Tverberg. I am an actuary interested in finite world issues - oil depletion, natural gas depletion, water shortages, and climate change. Oil limits look very different from what most expect, with high prices leading to recession, and low prices leading to inadequate supply.
Demeter
(85,373 posts)Demeter
(85,373 posts)U.S. oil production has begun to drop in response to low oil prices, but not as dramatically as many had anticipated.
Oil companies have cut back spending significantly in response to the fall in the price of oil. The number of rigs that are active in the main U.S. tight oil producing regions– the Permian and Eagle Ford in Texas, Bakken in North Dakota and Montana, and Niobrara in Wyoming and Colorado– is down 58% over the last 12 months.
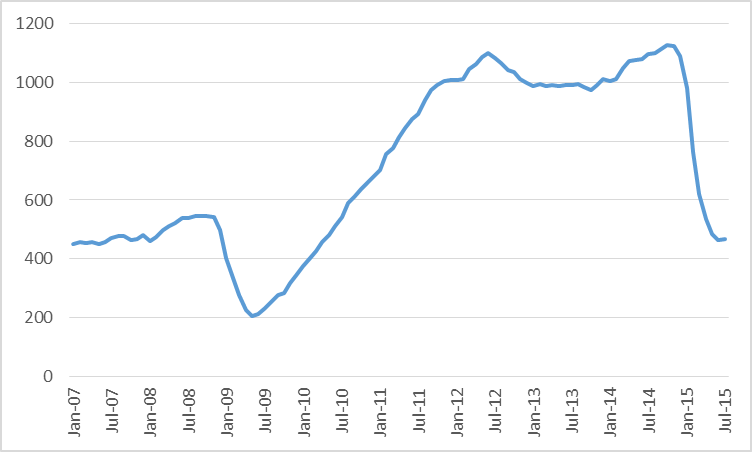
Number of active oil rigs in counties associated with the Permian, Eagle Ford, Bakken, and Niobrara plays, monthly Jan 2007 to July 2015. Data source: EIA Drilling Productivity Report.
Nevertheless, U.S. tight oil production continued to climb through April. It has fallen since, but the EIA estimates that September production will only be down 7%, or about 360,000 barrels/day, from the peak in April. (2015)
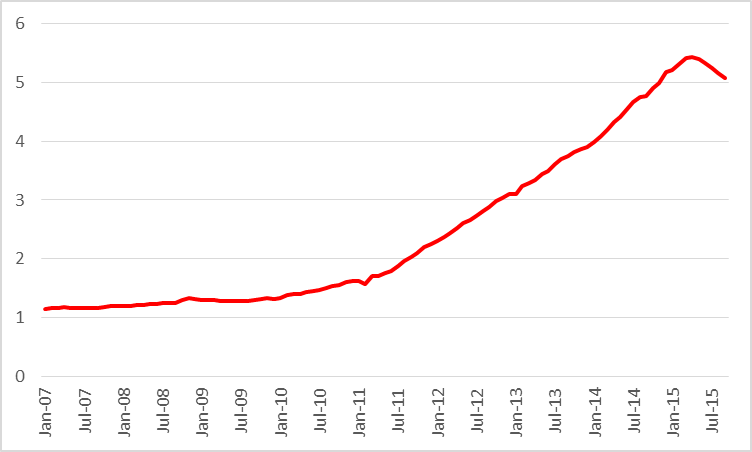
Actual or expected average daily production (in million barrels per day) from counties associated with the Permian, Eagle Ford, Bakken, and Niobrara plays, monthly Jan 2007 to September 2015. Data source: EIA Drilling Productivity Report.
This is despite the fact that typically output from an existing well falls very quickly after it begins production. The EIA estimates that tight oil production from wells that have been in operation for 3 months or more has declined by 1.6 mb/d since April, as calculated by the sum of the EIA estimated monthly declines in legacy production from May to September.
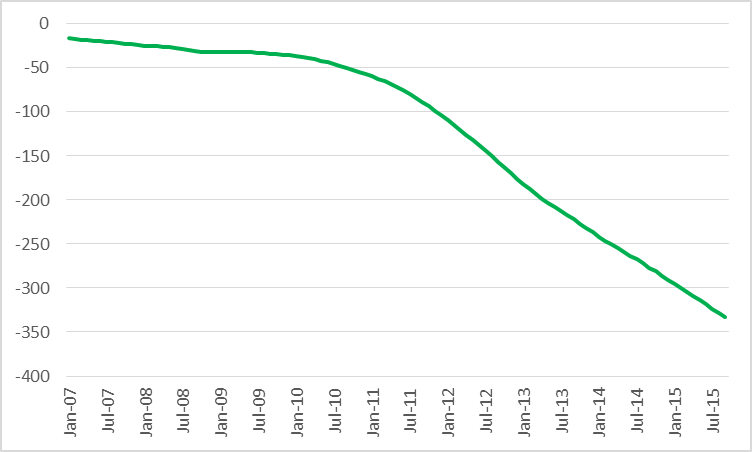
Legacy production change (month-to-month production change, in thousands of barrels per day, coming from wells in operation 3 months or more) in counties associated with the Permian, Eagle Ford, Bakken, and Niobrara plays, Jan 2007 to Sept 2015. Data source: EIA Drilling Productivity Report.
One would think that these decline rates from existing wells and the drop in the number of rigs drilling new wells would mean that production would have fallen much more dramatically. Why didn’t it? The answer is that there has been a phenomenal increase in productivity per rig. For example, the EIA estimates that operating a rig for a month in the Bakken would have led to a gross production increase of 388 barrels/day two years ago but can add 692 barrels today.
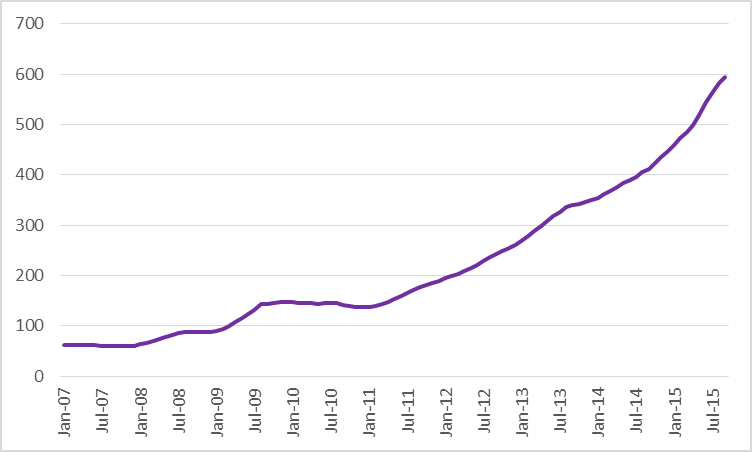
Average productivity (added gross daily barrels per month) per drilling rig from counties associated with the Permian, Eagle Ford, Bakken, and Niobrara plays, monthly Jan 2007 to September 2015. Data source: EIA Drilling Productivity Report.
A key factor in the productivity gains is that companies are finding ways to complete wells faster, so that more wells can be drilled each month from the same number of rigs. For example, The Barrel reports that Occidental Petroleum “has seen a 40% decrease in spud to rig release time in the Wolfcamp area of its Permian holdings from 43 days in 2014 to 26 days in March this year with a target of eventually reaching 16 days.”
The modest drop in U.S. production has been enough to start to bring inventories down. U.S. crude oil stocks last week were down more than 30 million barrels from April. But that still leaves them way above normal....
Demeter
(85,373 posts)Global growth disappoints again. A year ago, the International Monetary Fund expected world output to rise 4% in 2015. Now the Fund is forecasting 3.3% for the year – about the same as in 2013 and 2014, and more than a full percentage point below the 2000-2007 average.
In the eurozone, growth in the latest quarter was underwhelming. Japan has returned to negative territory. Brazil and Russia are in recession. World trade has stalled. And China’s economic slowdown and market turmoil this summer have created further uncertainty. True, there are bright spots: India, Spain, and the United Kingdom are beating expectations. The United States’ recovery is solid. Africa is doing well. But, overall, it is hard to deny that the global economy lacks momentum. This is partly because trees cannot grow forever: China’s economy could not continue to get 10% bigger every year. And in part, it is because growth is not unconditionally desirable: Citizens may be better off with a little less of it, and more clean air. But many countries are still poor enough to be endowed with strong growth potential, and many others, though rich, have not yet recovered from the global financial crisis. So there must be something else holding growth back.
There are essentially two competing explanations.
Both theories are internally consistent. Both also fit only some of the facts. The Secular Stagnation Hypothesis accounts well for the mistakes made in the eurozone in the aftermath of the global recession, when sovereigns attempted to deleverage while companies and households were unwilling to spend, and the ECB was keeping monetary policy relatively tight. The BIS’s explanation reads like a summary of the woes of China, where growth has slowed from 10% to 7% or less, but the authorities still push investment amounting to almost half of GDP and promote all sorts of low-return projects. So which theory fits the facts better globally? So far, it is odd to claim that advanced countries have stimulated demand excessively. Persistently low employment and near-zero aggregate inflation do not suggest that they have erred on the side of profligacy. True, financial recklessness remains a risk, but this is why regulatory instruments have been added to the policy toolbox. So the BIS’s call for across-the-board monetary normalization is premature (though this does not mean that reforms should wait). In the emerging world, however, the mismatch between growth expectations and actual potential has often become a serious issue that demand-side stimulus and endless debt accumulation cannot cure. Rather, governments should stop basing their legitimacy on inflated growth prospects.
I THINK THE ANSWER IS OBVIOUS: BOTH SCENARIOS ARE RUNNING IN DIFFERENT PORTIONS OF THE GLOBE, AND THEY HAVE CREATED A POSITIVE FEEDBACK LOOP SO THAT ONE FEEDS THE DYSFUNCTION OF THE OTHER AND VICE VERSA.
BUT THAT WOULD MEAN MINDS WOULD HAVE TO CHANGE.
I HAVE NO HOPE, I SEE NO FUTURE THAT ANYONE WOULD WANT TO ENDURE....
Demeter
(85,373 posts)Russian President Vladimir Putin has drafted a bill that aims to eliminate the US dollar and the euro from trade between CIS countries. This means the creation of a single financial market between Russia, Armenia, Belarus, Kazakhstan, Kyrgyzstan, Tajikistan and other countries of the former Soviet Union.
“This would help expand the use of national currencies in foreign trade payments and financial services and thus create preconditions for greater liquidity of domestic currency markets”, said a statement from Kremlin.
The bill would also help to facilitate trade in the region and help to achieve macro-economic stability.
Within the framework of the Eurasian Economic Union (EEU) the countries have also discussed the possibility of switching to national currencies. According to the agreement between Russia, Belarus, Armenia and Kazakhstan, an obligatory transition to settlements in the national currencies (Russian ruble, Belarusian ruble, dram and tenge respectively) must occur in 2025-2030. Today, some 50 percent of turnover in the EEU is in dollars and euro, which increases the dependence of the union on countries issuing those currencies.
Outside the CIS and EEU, Russia and China have been trying to curtail the dollar’s dominance as well. In August, China's central bank put the Russian ruble into circulation in Suifenhe City, Heilongjiang Province, launching a pilot two-currency (ruble and yuan) program. The ruble was introduced in place of the US dollar.
MORE IN LINKS
DemReadingDU
(16,000 posts)
9/1/15 Visualization Compares the Economies of Every U.S. State
This visualization today compares state economies by contribution to America’s GDP of $17.3 trillion (2014), while also grouping the states by geographical regions such as New England, Mideast, Great Lakes, Plains, Rocky Mountains, Far West, Southwest, and Southeast.
Most economic activity is concentrated in three regions: Far West (18.6%), Southeast (21.3%), and Mideast (18.2%). The states in these regions, which cover the majority of the coastline where most big cities are located, comprise nearly 60% of the U.S. total economic output. Compare this with sparsely populated regions such the Rocky Mountains, which contributes only 3.6% of economic output between five large states.
The largest individual state economies include California (13.3%), Texas (9.5%), and New York (8.1%). The smallest economy is held by Vermont (0.2%) with seven others contributing 0.3% of economic output: Maine, Rhode Island, North Dakota, South Dakota, Montana, Wyoming, and Alaska.
How has the relationship between state economies changed over time? The publishers at HowMuch.net note:
“All states have increased their economic outputs between 2011 and 2014, but some have grown faster than others. In terms of regional influence, the Southeast economy has shrunk in relation to other regions by just 0.4% over the last four years, while the Southwest economy has grown by 0.8% relative to other regions. Texas increased the size of its economy by almost $300 billion, more than any other state, growing from 8.8% of the US economy in 2011 to 9.5% in 2014. This growth in Texas was fueled by mining and manufacturing. California grew by just under $300 billion, but only increased its share of the total economy by 0.1%.”
http://www.visualcapitalist.com/this-simple-visualization-compares-the-economies-of-every-u-s-state/
DemReadingDU
(16,000 posts)
7/22/15 The World Economy in One Visualization
Today’s data visualization is the most simple breakdown of the world economy that we’ve seen. Not only is it split to show the GDP of dozens of countries in relation to one another based on size, but it also subtly divides each economy into its main sectors: agriculture, services, and industry. The lightest shade in each country corresponds to the most primitive economic activity, which is agriculture. The medium shade is industry, and the darkest shade corresponds to services, which tends to make up a large portion of GDP of developed economies in the world economy.
To take it one step further, the visualization also shades the countries by continental geography, to easily see the relative economic contributions of North America, Europe, South America, Asia, Oceania, and Africa.
http://www.visualcapitalist.com/the-world-economy-in-one-visualization/
DemReadingDU
(16,000 posts)Bloomberg video appx 11 minutes
9/2/15 Marc Faber: There Is No Safe Asset Anymore
Faber chuckles when the young interviewer lectures Faber what creates prosperity. @7:30 minutes
http://www.bloomberg.com/news/videos/2015-09-02/marc-faber-there-is-no-safe-asset-anymore

Hugin
(33,135 posts)Money is being thrown from one market to another searching for a "safe haven".
There is none at this point. It's all gamed out.
Hmm... Maybe they should try INVESTING.IN.LABOR!