Welcome to DU! The truly grassroots left-of-center political community where regular people, not algorithms, drive the discussions and set the standards. Join the community: Create a free account Support DU (and get rid of ads!): Become a Star Member Latest Breaking News General Discussion The DU Lounge All Forums Issue Forums Culture Forums Alliance Forums Region Forums Support Forums Help & Search

Tansy_Gold

(17,855 posts)
Tue Jun 21, 2022, 05:17 PM Jun 2022

STOCK MARKET WATCH -- Wednesday, 22 June 2022

STOCK MARKET WATCH, Wednesday, 22 June 2022


Previous SMW:
SMW for 21 June 2022


AT THE CLOSING BELL ON 21 June 2022


Dow Jones 30,530.25 +641.47 (2.15%)
S&P 500 3,764.79 +89.95 (2.45%)
Nasdaq 11,069.30 +270.95 (2.51%)


+++++++++++++++++++++++++++++++++++++++++++++++++++++++++++++++++++++++


Market Conditions During Trading Hours:

Google Finance
MarketWatch
Bloomberg
Stocktwits

(click on links for latest updates)


+++++++++++++++++++++++++++++++++++++++++++++++++++++++++++++++++++++++


Currencies:


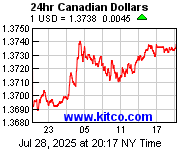
Gold & Silver:


Petroleum:


+++++++++++++++++++++++++++++++++++++++++++++++++++++++++++++++++++++++


+++++++++++++++++++++++++++++++++++++++++++++++++++++++++++++++++++++++


This thread contains opinions and observations. Individuals may post their experiences, inferences and opinions on this thread. However, it should not be construed as advice. It is unethical (and probably illegal) for financial recommendations to be given here.

1 replies = new reply since forum marked as read
Highlight: NoneDon't highlight anything 5 newestHighlight 5 most recent replies
STOCK MARKET WATCH -- Wednesday, 22 June 2022 (Original Post) Tansy_Gold Jun 2022 OP
S&P 500 still at bear market levels, 21.5% below its January 3 all-time high progree Jun 2022 #1

progree

(10,901 posts)
1. S&P 500 still at bear market levels, 21.5% below its January 3 all-time high
Wed Jun 22, 2022, 04:56 AM
Jun 2022

As for the U.S. total stock market, as measured by VSTAX, the Vanguard (U.S.) Total Stock Market fund

Since the end of January 2021 (1 1/2 years ago approx), it is down 1.45% in nominal dollars.

The purchasing power of the nominal dollar is down 10% since then, as measured by the CPI.

So the purchasing power of a VTSAX portfolio is down 11.3%, meaning if its purchasing power was $10,000 back then, it is $8,870 now.

CPI: https://data.bls.gov/timeseries/CUSR0000SA0

VTSAX history: https://finance.yahoo.com/quote/VTSAX/history?p=VTSAX
(use the Adjusted Close column to get the total return including reinvested distributions)

I chose the end of January 2021 as the starting point because that's about where the bend of the inflation curve is.

Latest Discussions»Issue Forums»Economy»STOCK MARKET WATCH -- Wed...