Welcome to DU!
The truly grassroots left-of-center political community where regular people, not algorithms, drive the discussions and set the standards.
Join the community:
Create a free account
Support DU (and get rid of ads!):
Become a Star Member
Latest Breaking News
General Discussion
The DU Lounge
All Forums
Issue Forums
Culture Forums
Alliance Forums
Region Forums
Support Forums
Help & Search
Environment & Energy
Related: About this forumNSIDC - July Arctic Sea Ice Extent @ Record Low; Rate Of Retreat 105k Km2/day; Avg 86k Km2/day
Overview of conditions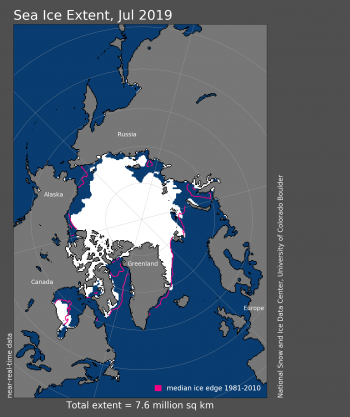
Figure 1. Arctic sea ice extent for July 2019 was 7.59 million square kilometers (2.93 million square miles). The magenta line shows the 1981 to 2010 average extent for that month. Sea Ice Index data. About the data
Arctic sea ice extent for July 2019 set a new record low of 7.59 million square kilometers (2.93 million square miles). The monthly average extent was 80,000 square kilometers (30,900 square miles) below the previous record low set in 2012 and 1.88 million square kilometers (726,000 square miles) below the 1981 to 2010 average. On a daily basis, ice tracked at record low levels from July 10 through July 14 and July 20 through the end of the month. Ice retreated over most regions of the Arctic Ocean, especially over the Laptev Sea, northern Chukchi and Beaufort Seas, and Hudson Bay, where no ice remained at the end of the month. There was little retreat in the Barents Sea where the ice edge had already pulled back to its average northward position for this time of year. Ice also continued to linger along the coast in the East Siberian Sea near the Russian port town of Pevek and Wrangel Island. However, the sea ice concentrations in the region are now low, with many open water areas between ice floes. By the end of the month, the Northern Sea Route that links Europe and Asia through the East Siberian and Laptev Seas appeared to be essentially open, whereas the Northwest Passage (both the southern and northern routes) remained blocked by ice.
Conditions in context
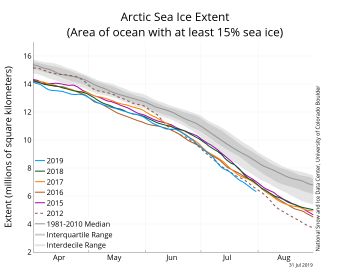
Figure 2a. The graph above shows Arctic sea ice extent as of July 31, 2019, along with daily ice extent data for four previous years and the record low year. 2019 is shown in blue, 2018 in green, 2017 in orange, 2016 in brown, 2015 in purple, and 2012 in dotted brown. The 1981 to 2010 median is in dark gray. The gray areas around the median line show the interquartile and interdecile ranges of the data. Sea Ice Index data.
July is typically the warmest month of the year, with the largest rate of ice loss. Sea ice extent this July declined at an average rate of 105,700 square kilometers (40,800 square miles) per day, exceeding the 1981 to 2010 average of 86,800 square kilometers (33,500 square miles) per day. Only seven previous years—1990, 1991, 2007, 2009, 2013, 2015, and 2018—experienced daily rates of ice loss exceeding 100,000 square kilometers (38,600 square miles) per day, with 2007 holding the record low of 114,200 square kilometers (44,100 square miles) per day.
Rapid ice loss for July 2019 was in part driven by warm conditions during the first half of the month. The latter half of the month, in contrast, was relatively cool over the East Siberian and Laptev Seas, as well as near Svalbard and the Canadian Arctic Archipelago, where temperatures at the 925 hPa level (about 2,500 feet above the surface) were 1 to 4 degrees Celsius (2 to 7 degrees Fahrenheit) below the 1981 to 2010 average. These relatively cool conditions were the result of below average sea level pressure centered over the East Siberian Sea, coupled with above average sea level pressure over the west Siberian Plain, which brought cold air southwards and helped to push the ice towards the coast. However, by July 30, the heat wave that had been plaguing Europe moved north, baking Greenland with above average temperatures of 10 degrees Celsius (18 degrees Fahrenheit) at the 925 hPa level while parts of the Arctic Ocean saw temperatures 1 to 7 degrees Celsius (2 to 13 degrees Fahrenheit) above average. During this heat wave, about 60 percent of the Greenland ice sheet experienced melt. Despite the fluctuations during the month, the average monthly temperature was above average over most of the Arctic Ocean (Figure 2c).
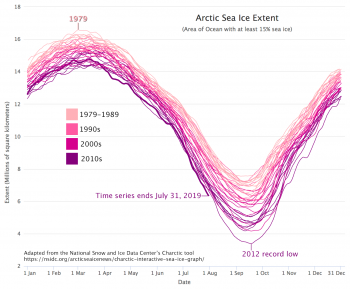
Figure 2b. The graph above shows Arctic sea ice extent decline per decade since satellite observations began in 1979. 1979 to 1989 is shown in light pink, the 1990s in dark pink, the 2000s in magenta, and the 201os in purple. 2019 is shown in a thick purple line ending on July 31, 2019, while the 2012 record low is also marked. Sea Ice Index data.
Rapid ice loss for July 2019 was in part driven by warm conditions during the first half of the month. The latter half of the month, in contrast, was relatively cool over the East Siberian and Laptev Seas, as well as near Svalbard and the Canadian Arctic Archipelago, where temperatures at the 925 hPa level (about 2,500 feet above the surface) were 1 to 4 degrees Celsius (2 to 7 degrees Fahrenheit) below the 1981 to 2010 average. These relatively cool conditions were the result of below average sea level pressure centered over the East Siberian Sea, coupled with above average sea level pressure over the west Siberian Plain, which brought cold air southwards and helped to push the ice towards the coast. However, by July 30, the heat wave that had been plaguing Europe moved north, baking Greenland with above average temperatures of 10 degrees Celsius (18 degrees Fahrenheit) at the 925 hPa level while parts of the Arctic Ocean saw temperatures 1 to 7 degrees Celsius (2 to 13 degrees Fahrenheit) above average. During this heat wave, about 60 percent of the Greenland ice sheet experienced melt. Despite the fluctuations during the month, the average monthly temperature was above average over most of the Arctic Ocean (Figure 2c).
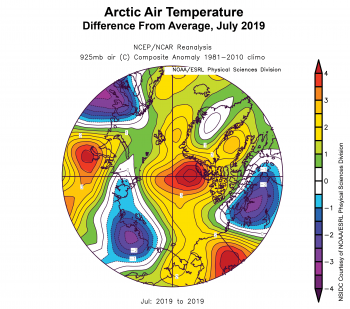
Figure 2c. This plot shows the departure from average air temperature in the Arctic at the 925 hPa level, in degrees Celsius, for July 2019. Yellows and reds indicate higher than average temperatures; blues and purples indicate lower than average temperatures.
By the beginning of August, the pace of ice loss tends to drop rapidly. 2012 was an exception, when the average August ice loss rate remained quite rapid at 89,500 square kilometers per day (34,600 square miles per day), leading to a new record low for the September minimum that year. As of August 5, 2019, the total sea ice extent has dropped below 6 million square kilometers, something which has not occurred prior to 1999. Sea ice extent in September of 2019 is likely to be among the five lowest minimums recorded.
July 2019 compared to previous years
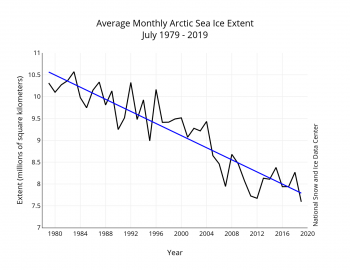
Figure 3. Monthly July ice extent for 1979 to 2019 shows a decline of 7.32 percent per decade.
In total, sea ice extent during July 2019 decreased by 3.28 million square kilometers (1.27 million square miles). This was larger than the 1981 to 2010 average loss for the month. The linear rate of sea ice decline for July from 1979 to 2019 is 693,000 square kilometers (268,000 square miles) per year, or 7.32 percent per decade relative to the 1981 to 2010 average.
Early melt brings early ice break-up and warmer ocean temperatures to the Beaufort Sea
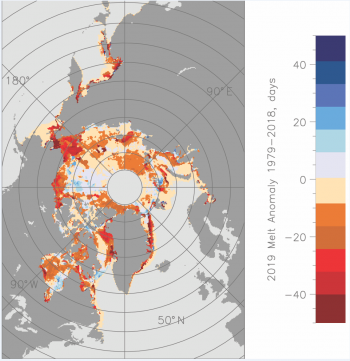
Figure 4a. This map shows the 2019 melt onset expressed as differences (in days) with respect to 1981 to 2010 averages. Values are based on the passive microwave satellite data record.
As mentioned in our July mid-month post, numerous ice floes have broken away from the main pack ice in the southern Beaufort Sea. This was in part fueled by early melt onset; ice began to melt nearly a month earlier than average (Figure 4a). Melt also started earlier than average within the northern Bering and southern Chukchi Seas and also within Baffin Bay along the west coast of Greenland. Melt onset over the central Arctic Ocean near the longitudes of the Laptev Sea, the Lincoln Sea, and parts of Hudson Bay was up to 20 days earlier than average. The timing of melt onset plays an important role in melt pond development and ice breakup, both of which allow for more solar radiation to be absorbed in the upper ocean, promoting more ice melt. The timing of melt pond development has been shown to be a useful predictor of how much ice will be left at the end of summer. The impact of this year’s early melt onset is evident in sea surface temperatures along the coast of Alaska and the Chukchi Sea, which are at least 5 degrees Celsius (9 degrees Fahrenheit) above average (Figure 4b).
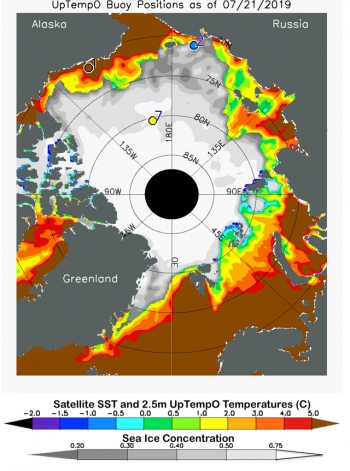
Figure 4b. This map of the Arctic Ocean shows sea surface temperature in degrees Celsius for July 31, 2019. Data are from the University of Washington Polar Science Center UpTempO buoys and satellite-derived values from the National Oceanic and Atmospheric Association (NOAA).
Wildfires continue to rage across Arctic region
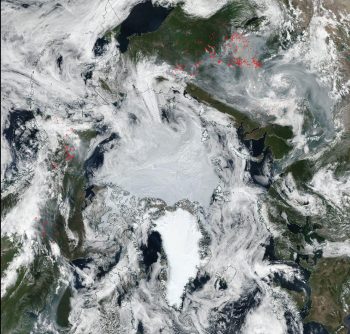
Figure 5a. This image from July 24, 2019 from the NASA Moderate Resolution Imaging Spectroradiometer (MODIS) sensor shows the locations of fires (red dots) in the Arctic. Since the beginning of June, more than 100 large wildfires have been observed
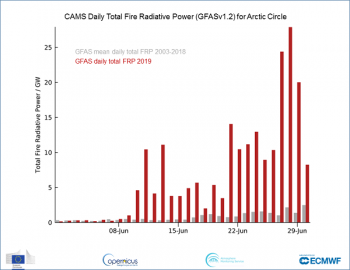
Figure 5b. This figure shows the Total Fire Radiative Power (TFRP) in the Arctic Circle detected by the Copernicus Atmosphere Monitoring Service (CAMS). Fire radiative power is a measure of heat output from wildfires as shown for June 2019 (red) and the 2003 to 2018 average (grey).
Another factor that plays a role in ice melt is deposition of dark soot from wildfires on the highly reflective snow and ice surfaces, allowing more of the sun’s energy to be absorbed. Since the beginning of June, more than 100 large wildfires have been observed over Arctic lands, including Alaska, Greenland, and Siberia (Figure 5a). Smoke from these fires has been observed to blow across Greenland and over sea ice areas. Wildfires do not only deposit soot, they also pose a health hazard to local communities. According to the European Union Copernicus Atmospheric Monitoring Service (CAMS), the fires this year are far more intense than normal, with a Total Fire Radiative Power (TFRP) up to about 10 times higher than average for a given date (Figure 5b). TFRP is derived from Moderate Resolution Imaging Spectroradiometer (MODIS) data and incorporates the thermal radiation (intensity of buring) and the amount of smoke produced. Further, the fires release a substantial amount of carbon dioxide. The report notes that these fires have released as much carbon dioxide into the atmosphere as the annual total emissions of Sweden, or more than 50 megatons of this greenhouse gas; this is more than all fires within the same month between 2010 and 2018.
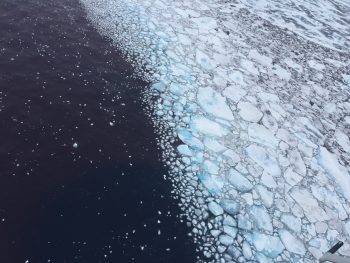
Figure 5c. In this photo taken during a NOAA flight north of Utqiagvik, Alaska, sea ice appears to be highly decayed with deep melt ponds.
The National Oceanic and Atmospheric Administration (NOAA) has been tracking the melt season with aircraft flights over the ice north of Utqiagvik, Alaska, as part of its Arctic Heat program. While onboard some of these flights in mid-July, Kevin Woods of the NOAA Pacific Marine Environmental Lab in Seattle, Washington took several photos of the sea ice (Figure 5c). The ice appeared to be highly decayed with deep melt ponds, many melted completely through the ice. In other areas, the ice was sparse with isolated floes surrounded by open water. Much of this is likely to melt out completely by the end of the summer.
Open water again north of Greenland
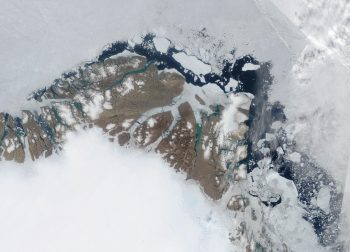
Figure 6. This true-color composite image taken by the NASA Moderate Resolution Imaging Spectroradiometer (MODIS) sensor shows sea ice as seen from an aircraft over Peary Land, Northeast Greenland. Areas of open water have appeared on the north coast of Greenland where two large floes that were fast ice broke away last week.
Once again, areas of open water have appeared on the north coast of Greenland. A similar situation was observed during two periods in 2018, including one in mid-winter and one in late summer. Two large floes that were fast ice (attached to the coast) broke away last week (Figure 6). The largest floe is roughly 110 kilometers by 65 kilometers (70 miles by 40 miles), about 50 percent larger than the state of Rhode Island.
EDIT
https://nsidc.org/arcticseaicenews/
InfoView thread info, including edit history
TrashPut this thread in your Trash Can (My DU » Trash Can)
BookmarkAdd this thread to your Bookmarks (My DU » Bookmarks)
0 replies, 453 views
ShareGet links to this post and/or share on social media
AlertAlert this post for a rule violation
PowersThere are no powers you can use on this post
EditCannot edit other people's posts
ReplyReply to this post
EditCannot edit other people's posts
Rec (8)
ReplyReply to this post