Environment & Energy
Related: About this forumSome energy, carbon and $$$ factoids (updated with a withdrawal due to my errors in the original)
Last edited Sat Jan 19, 2013, 03:10 AM - Edit history (9)
Edited to make major corrections. I goofed big time in this one.
Every year the oil company BP publishes figures for national and global energy use of all kinds going back to 1965. They also publish the amount of CO2 that was generated from our fuel-burning activities over the same period. The World Bank publishes a huge spreadsheet of economic data of all sorts, covering as many countries as they can, and aggregated globally where appropriate. Used together, these two data sources can be coaxed into revealing some interesting facts about our world.
One of the BP worksheets shows the world's use of primary energy - that is, all energy from fossil to solar, suitably massaged for approximate comparability. They reduce of everything into terms of "Tonnes of Oil Equivalent". From there it'a a straight conversion into electrical terms if one wishes (1 toe = 12 megawatt-hours).
I took the amount of CO2 emitted in each year and simply divided it by the primary energy consumption for that year, to get the first graph:
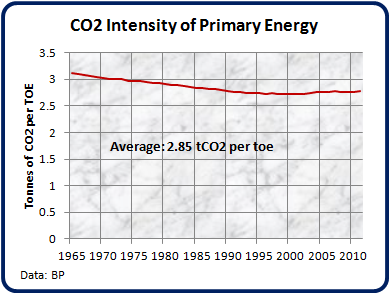
It's clear that we are not making much headway in decarbonizing our energy supply. In fact, since 2002 the situation has been getting marginally worse, thanks to China's coal consumption.
On edit: So far, so good. However the next two parts, about the power required to generate GDP and the "real" cost of carbon" were based on serious mistakes in methodology. I withdraw them in total. If you want to see them, click up a previous edit.
(Two parts with graphics deleted.)
The final section stands - this is still my view of things:
A serious implication of all this is that even direct carbon taxes won't help to decarbonize the economy. In fact, so long as there is a free market for fossil fuels and a free international flow of investment, they actually can't work at all. Here's the logic:
The money taken in by the tax stays in the global economy. As long as that happens, that money will rapidly flow to some place in the economy that makes things. When it comes to rest, it will be somewhere in the process of manufacturing, where it will simply fuel the perpetual cycle of growth in global GDP and CO2. Efficiencies will appear wherever the taxes are levied, but that will just make it easier for the overall economy to grow, as the efficiency will simply spare the local carbon that will be consumed somewhere else in the world.
This all reinforces my basic opinion: The only thing that would cut global CO2 emissions significantly any time soon is a world-wide economic crash.
 = new reply since forum marked as read
Highlight:
NoneDon't highlight anything
5 newestHighlight 5 most recent replies
= new reply since forum marked as read
Highlight:
NoneDon't highlight anything
5 newestHighlight 5 most recent replies
GliderGuider
(21,088 posts)
Iterate
(3,020 posts)From
http://data.worldbank.org/indicator/EN.ATM.CO2E.PC
http://www.indexmundi.com/united_states/gdp_per_capita_%28ppp%29.html
Year 2000 GDP was 36,200, so I suppose the rest is on a credit card.
Your point is well made, but I wonder if 2000 CO2 shouldn't be used. Or maybe my first glance is nearsighted.
Regardless, advocating a tweak around the edges, a little buff and polish...I don't even want to finish that sentence.
Intentional (and flawed) reset or brutal collapse?
GliderGuider
(21,088 posts)There's no need to focus on a single year for CO2 production, because CO2 is a physical commodity. It's considered in terms of quantity, not price. So long as the financial quantity we relate it to has a constant value, the ratio is valid. That's why I used inflation-adjusted dollars.
Basically I've come to the conclusion that no amount of policy change or renewable energy will slow global warming so long as the world economy remains intact, and continues to function under its current paradigm.
It seems that the paradigm that has trapped us runs like this:
- Nations compete in an unconstrained manner for power on the world stage;
- Wealth = power;
- Real wealth = manufactured goods;
- Manufactured goods embody energy; and
- Fossil fuels provide the largest source of available energy.
As long as that paradigm holds, climate change cannot be stopped. The world will continue to burn all the fossil fuel that's required to support the maximum level of economic activity possible.
Iterate
(3,020 posts)I get you, I just needed a nap. Gawd knows it's dark enough. 
This is from http://www.indexmundi.com/facts/indicators/EN.ATM.CO2E.PP.GD.KD/compare#country=de:mx:gb:us and http://www.indexmundi.com/facts/indicators/EN.ATM.CO2E.PP.GD.KD/rankings
It's a slightly different way of presenting the same idea. At the site you can go through national measures, but I don't see a global tally. For most counties the slope does show a trend of some sort, but in cross-checking, of course, in none does it equal a substantial CO2 decrease.
Although it's not explicitly shown here, cross-checking data also shows that in one way or another, nation by nation, improvement in the embedded CO2 per $ PPP (or GDP) gets taken up by growth (population or consumption), profit, or it's temporarily produced by depression or offshoring manufacture.
That begs the question: when exactly would each nation's needs be met so well that CO2 elimination would be the priority? I'd say never, or half-hardheartedly and too late. And until the growth paradigm is broken, that dynamic stays in place.
So every US dollar spent has .9 lb. CO2 embedded - far higher than even the EU or Japan. Somehow I can't imagine wringing that out without breaking something.

GliderGuider
(21,088 posts)And any nation that aspires to climb the ladder of global power ladder has to do it with, well, power. That means that there will be no end to it unless all nations decide to stop trying to scramble for the top of the hill. The way civilization has developed over the last 10,000 years, that's simply not an option.
The place this is leading me to is an examination of how virtually all competitions are won by the groups/nations/systems that use the most energy the most effectively. This includes the rise of agriculturalists over hunter-gatherers, the succession of European empires, the decimation of indigenous groups by foreign settlers, the victory of the Allies over the Axis in WWII, the Cold War defeat of Russia by the USA, American global hegemony since WWII, and now the rise of China.
When seen through an "energy lens" these outcomes all tell the same story: "During self-organization, system designs develop and prevail that maximize power intake, energy transformation, and those uses that reinforce production and efficiency."
So I don't think it's going to end, because we're talking about a fundamental principle of self-organizing systems here. Our illusions of volition and free will may blind us to the obvious, but human affairs are run by this principle in the same way that they are governed by the laws of physics and thermodynamics. We can't simply decide to stop this innate process, any more than we can decide to fall up instead of down.
http://en.wikipedia.org/wiki/Maximum_power_principle
Iterate
(3,020 posts)and history has been more of my long suit than anything else. The Doggers are interesting, but they were certainly not exceptional, really more of a cautionary tale. Let's put it this way, 2500 years ago the Athenians were worried about the disastrous effects of having idiot sons rise to power, the British simply exported them, and the Americans seem to have embraced them. And that's a smaller problem never solved.
I've been thinking of the Japanese Sakoku, wondering if the limitation of resources led to an culture that valued mastery rather than production. So far the answer is, it didn't. The islands were plentiful, until they weren't.
I don't see how there would be an example in history. Not possible. If anything, it's reaffirmation of the same population/resource>expansion>conflict>collapse pattern.
Biology either. Why, or how, would evolution limit itself? I had thought at first there might be an example in microbiology, but even the host/parasite red queen race ends in symbiosis, and that's not helpful. The black queen theory was interesting as it suggested organisms minimize effort and expense by exporting difficult toxins to the commons where other organisms can use it as a resource. The trick is to get rid of the black queen, as in hearts. Informative perhaps, but I already had the suspicion that bugs shit and rich nations send e-waste to African and south Asia.
OK, I'm off metaphorically to the Santa Fe Institute to see what anyone there is thinking. It has been a while.
But first...off the wall.
A parallel economy based on the carbon dollar. Everything you earn or buy in a year is paid in carbon dollars. Your goal is to earn none and spend none. If you do, that amount is taken away from your account of old, real dollars. Two sets of books. Who wouldn't like that?
GliderGuider
(21,088 posts)This is one that's caught my interest for obvious reasons. It doesn't require a belief in limits, or limitlessness, or collapse or anything else. I think the situations that being self-organizing systems to collapse are different than the ones that promote their growth, but they are probably all part of the adaptive cycle that's at the heart of resilience theory.
The maximum power principle is most visible during exploitation phase, where ecosystems/nations/civilizations are growing. We're near or at the top, about to enter the releasing phase. A system collapses if its exploitation phase carries it deep into overshoot, as ours has. At that point issues like Liebig Limits come into play, and network failure cascades become an ever-greater risk.
Carbon dollars are a nice idea, but parallel economies are usually seen as an inefficiency, though. Get the USA, China, India and Europe to adopt them and we'll see if they work...
Iterate
(3,020 posts)Outside of London and Frankfurt, the EU might be crazy enough, but it appears the US thinks it's going to win something in a prohibited state space.
I haven't missed your maximum power and resilience posts. Just letting them simmer and settle a bit. It did make me think of something I'd noticed on Rosling's site that has become a puzzle that won't go away.
Somewhere there you can track per capita sugar consumption over time and by nation. If we were dealing with something that was strictly biological/genetic/economic, it would eventually depend upon income and proximity to the resource, but it doesn't. The US is a bit of an outlier, but for most nations it reaches a level and stays there, more or less, over time.
And that hints at a kind of national/cultural set-point for consumption that gets establish quickly and persists through habit and economic relationships. That wouldn't refute maximum power, but suggests some islands of stability, stable at least until they are perturbed.
NoOneMan
(4,795 posts)Wow. Maybe that should be put under "In God We Trust"
Iterate
(3,020 posts)I've seen the numbers for ages in other formats, but that was difficult to type, difficult to put in that context. Unless I pulled a Jethro and got my naughts in the wrong place, that's about it, within the margins of the data provided.
2010
$14,660,000,000,000 GDP
In 2010, U.S. greenhouse gas emissions totaled 6,821.8 million metric tons CO2 Eq. = 1.50394946 × 10^13 pounds =15,039,494,600,000
So 2010 was nearly one-for-one.
I was looking at my overly detailed electricity bill a few months ago and they had thoughtfully noted that the CO2 rate was 503g/kWh. The US rate is more difficult to pin down, but is around 740g/kWh? or so. Simple hurdle #1 would be for institutions to collect data and put it into useful, flexible formats. I'll be changing my power provider finally to all renewable.
But that's still a pound for now, more or less. For one kWh. I use less than one per day, but still...I bought a pound of CO2. Now wtf am I going to do with it? Chuck a tree down a mineshaft? Kill some chickens?

OKIsItJustMe
(19,938 posts)[font size=4]1973, from fact + -oid, first explained, if not coined, by Norman Mailer.[/font]
[font size=3] Factoids ... that is, facts which have no existence before appearing in a magazine or newspaper, creations which are not so much lies as a product to manipulate emotion in the Silent Majority. (Mailer, "Marilyn," 1973)[/font][/font]
The “oid” suffix means something which resembles something else (as in sphereoid, something which resembles a sphere, but is not a sphere.)
In the same way, a factoid resembles a fact but is not a fact.
GliderGuider
(21,088 posts)Thanks for the note. I'll adjust my usage from now on when I present these interestin, out-of-the ordinary little facts.
NoOneMan
(4,795 posts)Like a witty 'hey, did you know' bit.
OKIsItJustMe
(19,938 posts)I first noticed factoid being regularly misused by CNN a couple of decades ago. It was rather ironic, since Mailer suggested that factoids were media creations (something which is reported as a fact, and therefore accepted as a fact, without, in fact, being a fact.)
See also: truthiness
GliderGuider
(21,088 posts)OKIsItJustMe
(19,938 posts)I am amused by how languages evolve.
GliderGuider
(21,088 posts)"Facts" are difficult beasts that insist on being correct. "Factoids", not so much. I presented factoids. As I said to muriel_volesterangler below, I fucked up. I withdraw the weirder parts of my article, and apologize for inflicting my confirmation bias on people.
NoOneMan
(4,795 posts)Last edited Fri Jan 18, 2013, 09:14 PM - Edit history (1)
What I can't make sense of is if US dollars command less and less energy (implying production costs more and more to generate the same amount of wealth), then how can we ever maintain a set level of growth without accumulating infinite debt (debt being the idea of pretending the previous cycle created more wealth than it really did)?
At what point does everyone really wake up and realize the economy literally can never function without debt that it cannot ever pay back? And what happens when that point comes? And what happens if that point comes when our agricultural fields are shot and the waters are creeping?
Nothing to see here folks.
on edit: I suppose this doesn't imply we must create debt if the original returns were very positive, but rather that returns are being diminished (until it gets to a point where debt must be created, or perhaps it is being created publicly to ensure the private returns stay the same). In any case, its a real problem that demands more and more capital always must be put into the system to produce a steady rate of returns.

muriel_volestrangler
(101,306 posts)For instance, is the world GDP you've got from the World Bank at official exchange rates, or purchasing power parity? It makes a lot of difference - "In 2011, the GWP totalled approximately US$79.39 trillion in terms of purchasing power parity (PPP), while the per capita GWP was approximately US$11,900". Given the large difference, which figure do you think is more appropriate to use for a carbon price, and why?
Also, I'm unclear how you have converted a world CO2 emission figure of, say, 34,033 million tonnes for 2011 (from the BP statistical review) to a figure of about "12.2 tonnes" (ie the highest CO2 emissions we've had) in your 3rd graph. You're dividing by something, but I can't see what. I presume you divide world GDP by the same figure as well - but we need to check (and I'd ask why you divide by it, without explaining, when that makes all your source figures unclear). And I'm pretty sure that, however you arrived at it, your 2nd graph should be labelled in watts, not milliwatts. With world power consumption on the order of 15 TW, and GWP in today's dollars also of the order of tens of trillions, the GDP to watt ratio should be of the order of one to one, not 3 to 1000. If it were watts, it would actually fit with 1 GW being matched with $3.125 billion, as you suggest in your text.
However, I'd question your assertion that "bringing a 1 GW power station on line will add about $3.125 Billion to the global GDP each year it operates". Correlation is not causation. And to say that this therefore shows the 'true value' of CO2 is even more of a leap. CO2 has not been in the minds of many of those who decided the type and amount of energy consumption of the world for 50 or so years. The CO2 intensity of primary energy has been largely flat mainly because of geopolitical and geographical considerations of what fuels are available to whom. The only effort to decrease CO2 production, Kyoto, only applies to a subset of the world, and even then there are coincidences that have to be taken into account, such as the availability of natural gas and the political desire to use it, or oil, or coal, or nuclear for non-climate-related reasons.
GliderGuider
(21,088 posts)First of all, rhe data for GDP is from the World Bank's WDI 2012 dataset (http://databank.worldbank.org/databank/download/WDI_excel.zip). The series is called "NY.GDP.MKTP.KD". The title is "GDP (constant 2000 US$)" and is described as follows:
"GDP at purchaser's prices is the sum of gross value added by all resident producers in the economy plus any product taxes and minus any subsidies not included in the value of the products. It is calculated without making deductions for depreciation of fabricated assets or for depletion and degradation of natural resources. Data are in constant 2000 U.S. dollars. Dollar figures for GDP are converted from domestic currencies using 2000 official exchange rates. For a few countries where the official exchange rate does not reflect the rate effectively applied to actual foreign exchange transactions, an alternative conversion factor is used."
The World Bank number for 2011 global GDP was $42.5 trillion in 2000 dollars.
BP's number for primary energy consumption in 2011 was 12774.6 Mtoe, which calculates out to 16.81 TW.
BP's number for CO2 emissions in 2011 was 34 Gt.
So, doing simple math, in 2011:
Each watt of power generated $2.53 of GDP;
Each dollar of GDP had 800 grams of CO2 embedded;
Each watt of power generated 2 kg of CO2.
What caused me to screw up so badly was that I was interested to see if I could replicate Utah researcher Tim Garrett's rather controversial result that the power/GDP is a constant. My mistake was to use a scatter plot, where the straight line correlation fooled me into thinking I'd found it myself.
By the way, one of the things that makes Garrett's result of 10 milliwatts per $ of GDP controversial is how he derives what he calls "GDP" - it's the summation of all GDP since the beginning of history (the math in the paper I read makes it hard to follow, which is why I missed that element and went off down this rabbit hole. His approach is a little easier to understand here: http://www.inscc.utah.edu/~tgarrett/Economics/Calculation_of_wealth.html
Then there was my finger trouble in which I mistakenly re-used the energy numbers for CO2, which was the division issue you noticed.
All in all, it's been quite an adventure in confirmation bias for me. I withdraw everything in the original except for the first graph of the carbon intensity of global primary energy. I want to thank you for taking the time to sniff-test my results and alert me to the problems. Your help saved me from looking like an idiot on a wider stage

One note: I still think that energy causes GDP, it's not just a simple correlation. Adding energy to the global economy will tend to increase the GDP, in a similar way that adding heat energy speeds up chemical reactions. We can't do anything without energy, and the only way to decouple GDP from it to a degree is to include things like the effects of debt creation. At its core what we're trying to measure is material wealth. And without energy, there can't be any.