Environment & Energy
Related: About this forumLying With Charts, Global Warming Edition
http://motherjones.com/kevin-drum/2012/01/lying-charts-global-warming-editionn my email today, the Washington Times passes along some great news: "Global warming trend ended in 1997, new data shows." The link is to a piece in the Daily Mail that, sure enough, tells us that our real worry isn't warming, it's the possibility of the Thames freezing over. And to prove that the world is no longer heating up, they include one of my all-time favorite graphs. I've recreated it using NASA data:

Look! No warming trend! But do you see the problem? I've given you a hint by embedding the 1997-2011 data within a larger chart, instead of just producing it on its own, as the Mail did. So that should make things pretty obvious. But in case you need a bigger hint, click the link for the full set of data, not cherry-picked to begin with the huge El Niño spike of 1998.
Hey look! The warming trend is back!

 = new reply since forum marked as read
Highlight:
NoneDon't highlight anything
5 newestHighlight 5 most recent replies
= new reply since forum marked as read
Highlight:
NoneDon't highlight anything
5 newestHighlight 5 most recent replies
immoderate
(20,885 posts)This is from the Skeptical Science site, a very good source for debunking climate info.

Here's the page. It's a good place to look around. They only reference peer reviewed science, and my climate denier friends (yes, I have a few) really hate it. 
http://www.skepticalscience.com/big-picture-global-warming.html
It is hilarious that these "fundies" try to refer to themselves as "skeptics."
--imm


Viking12
(6,012 posts)
Jim__
(14,074 posts)
Dead_Parrot
(14,478 posts)Nice find.
immoderate
(20,885 posts)I'm sure you'll give a link to SkS. It's a useful site in that it is dedicated to debunking the deniers!
Thanks. 
--imm
Dead_Parrot
(14,478 posts) 
tabatha
(18,795 posts)If all the averages were connected by a line, it would still go up.
Same if all maximums were connected or all minimums,
But the lying line joins average - maximum - average - minimum.
This should make any scientist cringe.
Viking12
(6,012 posts)it just that one cherry-picks a start date to skew the data.
Dead_Parrot
(14,478 posts)3/4 of the first points are below it, and 3/4 of the last points are above it.
To be fair, though, the DM article didn't include a trend line.
Viking12
(6,012 posts)The Croquist
(1,289 posts)Any idea why the second chart starts in 1961?

XemaSab
(60,212 posts)
guardian
(2,282 posts)is also true. Doomers cherry pick graph scale and data range to periods to deliberately deceive or hide what the data might tell us, or that distract from discerning the meaning of the data presented in the chart.

OKIsItJustMe
(19,938 posts)[font size=3]The current favorite argument of those who argue that climate changes isn’t happening, or a problem, or worth dealing with, is that global warming has stopped. Therefore (they conclude) scientists must be wrong when they say that climate change is caused by humans, worsening, and ultimately a serious environmental problem that must be addressed by policy makers.
The problem with this argument is that it is false: global warming has not stopped and those who repeat this claim over and over are either lying, ignorant, or exhibiting a blatant disregard for the truth. Here is a tiny sample of the false claims, gleaned from various blogs, comments to my previous Forbes posts, op-eds in the Wall Street Journal, news stories, and statements from pundits who spread climate misinformation:
“The supposed ‘consensus’ on man-made global warming is facing an inconvenient challenge after the release of new temperature data showing the planet has not warmed for the past 15 years.”
…
But even these selections of time periods are cherry picking. What about the entire instrumental record going back 130 years – the period of time when scientists know that growing concentrations of heat-trapping gases in our atmosphere have been piling up? Well, you look at the graph. The warming is unmistakable, despite the year-to-year ups-and-downs.

…[/font][/font]
Nederland
(9,976 posts)The question that I noticed you didn't ask, the question that doomers NEVER ask, is: "how much warming?"
Looking at your graph, the answer clearly is: "not a whole lot."
XemaSab
(60,212 posts)Nederland
(9,976 posts)It is really not that hard to understand...

joshcryer
(62,269 posts)It is really not that hard to understand...
Nederland
(9,976 posts)Do you have a point?
joshcryer
(62,269 posts)Albedo being but one of them.
Nederland
(9,976 posts)I do. My point, clearly articulated in post #15, is that global warming doomers never want to talk about how much warming we will see over the next 100 years. A review of all of your posts on this thread confirms that assertion. The reason doomers never want to talk about how much warming there will be over the next 100 years is because the science of predicting climate has not matured enough to know the answer with any degree of certainty. The simply fact is that the set of actions we should take if there will be 6 degrees of warming are very different than the set of actions we should take if there will only be 2 degrees. In other words, the uncertainty matters--a great deal.
XemaSab
(60,212 posts)if the temperature goes up 2 degrees or if it goes up 6 degrees?
Failure to act is in and of itself a course of action.
But of course you knew that.
joshcryer
(62,269 posts)Nor has anyone else in this thread as far as I can tell.
"Only" 2 degrees is very low end estimate, that's the baseline. You don't say "only 2 degrees," you say "minimially 2 degrees."
Given the uncertainties I think then it is paramount that we actually try to do something.
What bugs me about diminishers is not that they diminish or dismiss the data or the concerns.
It's that nothing is being done yet they expend so much effort on trivialities.
What have you to worry about? Nothing is or will be done.
XemaSab
(60,212 posts)That being said, I feel like deniers just deny for the sake of "Fuck you, hippie."
The little corner of my soul that IS a hippie wants to be like "Fuck you back, you knuckle-dragging, FOX News-watching, shack-dwelling, USA!USA!USA!-chanting, inbred motherfucker."
The rational part of my brain, though, says that the best argument against deniers is asking them if they really like taking it up the ass from the Saudis and other terrorist countries.
To play devil's advocate here, on the off chance that climate change ISN'T really happening or that it ISN'T manmade, why wouldn't we want to get off fossil fuels?
Fossil fuels have really fucked our foreign policy, destroyed our mountains and coastlines, and polluted our water and skies.
Moreover, at some point oil, coal, and natural gas will run out.
Why not tell the Saudis and other dictators and oppressive foreign powers to go to hell and create our own energy right here, right now?
It would create jobs and solve a lot of problems.
Besides, it's better to make a hard plan and stick to it now than be caught holding our metaphorical dicks when our supply is cut off.
XemaSab
(60,212 posts) Nederland
(9,976 posts)There are many reasons temperature is going up, some anthropogenic and some not.
GliderGuider
(21,088 posts)Because it sort of looks like a "fuck-of-a-lot" to me...

Nederland
(9,976 posts)I can make anything look like "a whole lot" or "a whole lot of nothing" simply by choosing the scale on the Y-axis to produce the desired result. Your chart proves absolutely nothing.
And don't get me started on the quality of ocean heat content data prior to the completion of the Argo array in 2006.
GliderGuider
(21,088 posts)Will you let James Hansen and all those other worry-warts know, or shall I?
You do know that large complex systems that are in dynamic balance tend to have unpredictable, and sometimes very strong, responses to small changes? Once they happen, it's too late to do anything about it.
Nederland
(9,976 posts)If you really believe this to be true, it sounds like you need to have a conversation with James Hansen yourself. The description above is basically saying that climate is a chaotic system (which is odd, because claiming that climate is a chaotic system is a typical skeptic claim). Perhaps you should tell James Hansen that he has spent a good portion of his entire career trying to create computer models that predict what you are saying is "unpredictable".
Stick to overpopulation issues GG. It is clear you don't know enough about AGW to even know what side believes what...
GliderGuider
(21,088 posts)A system doesn't need to be classically chaotic to exhibit those tendencies, which is why I didn't use the term.
For a discussion around this topic see http://www.realclimate.org/index.php/archives/2005/11/chaos-and-climate/
Nederland
(9,976 posts)Hansen certainly does not believe climate change to be "unpredictable".
GliderGuider
(21,088 posts)Last edited Thu Feb 9, 2012, 12:35 PM - Edit history (1)
Examples of the sort of unpredictability I'm talking about might be changes to the timing and duration of the monsoon season, or shifts in the THC.
The problem with saying "climate change is predictable" is that only some aspects of it are predictable. The impact of those predictable large-scale changes on significant subsystems like weather can be quite unpredictable.
Nederland
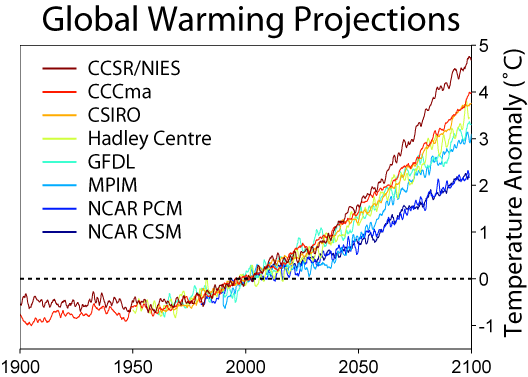
(9,976 posts)IPCC models have already been shown their inability to accurately predict temperatures:

Here we are in 2011, and observed temperatures have already fallen below the 1sigma model spread for simulation runs that took place in 2006. Why in the world would you place any stock in a computer models ability to correctly predict what temperatures will be like in 100 years when they cannot even predict the next 5 years correctly?
GliderGuider
(21,088 posts)and then you complain when I say some aspects are predictable. If I weren't such an inherently generous creature I'd suspect you of disagreeing just to be disagreeable. But I'm sure you have a noble purpose, so here goes.
What I think is that general changes in parameters like the average atmospheric and/or oceanic temperature - especially when aggregated over the entire globe or large portions of it - are in principle predictable. I say that because when you aggregate to that extent the chaotic aspects of the system are smoothed away - the system behaviour becomes much less chaotic and more predictable.
Right now climate change is unpredictable not because of any mathematical constraints but because of insufficient knowledge. Although it's predictable in principle, it's unpredictable in practice at the moment - the models we have available are still babies compared to the true complexity of the system. We don't know all the relevant variables and their interrelationships yet, because we haven't been doing it long enough, but I think there shouldn't be any mathematical or physical laws standing in the way of improved predictability as we learn more about the system. I could be proven wrong, though, because there's a lot about the system we don't understand yet. It could still turn out to be fundamentally chaotic after all. Let's hope that's not true.
That's not the case as the granularity of the pieces of the system under consideration get smaller, either in space or time. Once you lose the smoothing and buffering effects of aggregation, the chaotic aspects of the system begin to dominate. Under those conditions the behaviour becomes unpredictable in a formal, mathematical sense - no matter how much data we acquire, the system behaviour can't be predicted. It is unpredictable both in practice and in principle. Predictable large-scale systems give rise to chaotic, unpredictable local effects.
A simple example would be a river during spring snow-melt. We can use well-known variables like snow-pack depth, snow condition, air temperature and topography to predict the river's flow rate with pretty good accuracy. If we don't know the condition of the entire snow-pack in the catch basin we won't be able to predict the flow rate accurately, but that's a practical limitation, not a theoretical one.
However, we can't predict the changes in eddy patterns that form in the river as the flow rate increases, because those eddies are chaotic systems. Predicting the flow rate more precisely doesn't help to predict the eddy patterns at all. The best we can say is that at some flow rate the turbulence in this general area of the river will increase to some degree, and perhaps provide reasonable error bars.
It's the same for climate, except that the whole system is much larger and more complex than a river. The practical difficulties of global prediction remain enormous, but are in theory soluble. Changes in regional climate are harder to predict as the region gets smaller because chaotic effects begin to dominate the system behaviour.
This stuff isn't rocket science - it's actually much tougher than that.
Nederland
(9,976 posts)Climate change is a very immature science at this point in time. I believe that in time we probably will be able to accurately predict what impacts certain changes will have on climate, but that time has not yet come. I don't believe that I was "complaining" when you said things are unpredictable, but I can see why you might see it that way. My intention was merely to point out that the position you hold seems at odds with the rest AGW community whose mantra is "the science is settled". Now that you have fully articulated what you think, I'm surprised to see that we agree a great deal on the subject. If I had to sum up my own position on the subject I would say two things.
1) We don't understand climate very well at this point in time.
2) Our current level of understanding has produced computer models that over predict warming.
This combination is what makes me say that there will not be as much warming as many people claim around here claim there will be. Why do I believe this? Right now, depending on what scenario you pick, AR4 IPCC models predict warming over the next 100 years to be anywhere from 1.4 to 5.0 degrees. When you add in the fact that the observed temperatures for the five years following the model runs have come in under the 1.4 degree line, I cannot come to any other conclusion. Is that a guess? Absolutely. However, it is the only guess that makes sense at this point in time. The bottom line is that the only data we have tells us that the computer models are over predicting temperature. To guess otherwise requires that you ignore that fact.
I know how many people respond to this, indeed I have heard it many times right here in this forum. They say: "You may be comfortable risking the welfare of the plant on a guess, but I am not. Better to be safe than sorry." This view only makes sense if the world has an infinite supply of talent and money to fix problems. We do not. The total sum of the planet's human resources available to solve problems is fixed. If you dedicate resources to try to address the climate change issue, you take resources away from something else. Given this, I fail to understand the wisdom of throwing billions of dollars at a problem that we do not yet fully understand.
XemaSab
(60,212 posts)Well, thank goodness for that. I've been all worried about nothing.
joshcryer
(62,269 posts)2.3695428 * 10^20 btu of heat energy every year. That's 236 quintillion. Or 430 times all energy consumed by humans annually. And rising.
That's a shit ton, imo, especially if we have no attributable cause for this increase in heating other than greenhouse warming.
Nederland
(9,976 posts)The amount of energy consumed by humans annually? How is that relevant?
I think the proper number to compare here is the total amount of energy absorbed by the earth every year, which is 3,850,000 exajoules (EJ) per year (http://en.wikipedia.org/wiki/Solar_energy).
joshcryer
(62,269 posts)Do the math yourself.
Nederland
(9,976 posts)Now it starts to look a lot less "massive", doesn't it?
joshcryer
(62,269 posts)Running that entire time, producing only waste heat in the ocean.
My contention is that the Y scaling here is fine. To have a Y scaling that hides the divergence, you'd have to chose some arbitrary number that has no connection to anything.
Scale it based upon Earth EJ absorbed, land+atmosphere+ice become a very flat line:

The scaling is fine.
Nederland
(9,976 posts)Pointing out that this is equivalent to 190,000 1GW nuclear power plants dumping heat into the ocean proves nothing. All it serves to do is demonstrate how insignificant human heat production is when compared to the amount of energy the earth is bombarded with by the sun every day.
OKIsItJustMe
(19,938 posts)What it shows is “how insignificant human heat production is when compared to the amount of energy the” greenhouse gases we have emitted are trapping in the atmosphere.
Nederland
(9,976 posts)...help you predict how much warming there will be?
OKIsItJustMe
(19,938 posts)But we’ve been through this all before…
http://www.aip.org/history/climate/co2.htm
Nederland
(9,976 posts)...to accurately calculate how much warming there will be, why have climate models utterly failed to do so?
BTW, I have to laugh at your claim that predicting climate is "reasonably straightforward". I think the people that have spent years trying to create programs that accurately model our climate would be slightly offended by your assertion.
OKIsItJustMe
(19,938 posts)For the most part, it’s a matter of refinement, taking advantage of faster and faster computers to do more complex modeling, not of replacing wildly inaccurate models with radically different models.
We’ve been over this all before:
http://www.gfdl.noaa.gov/climate-modeling
http://www.research.noaa.gov/spotlite/archive/2011/articles/climate-model-history.html
http://www.ucar.edu/communications/CCSM/history.html
http://www.aip.org/history/climate/GCM.htm
http://www.csa.com/discoveryguides/models/review2.php
Nederland
(9,976 posts)The question is, what level of accuracy do you believe is necessary before we can claim even modest confidence in their predictions?
OKIsItJustMe
(19,938 posts)Are you familiar with any models that call for maintaining the same temperature?
At this point, the models predict a range, from too much warming (>2°C over 2000 temperatures by 2100) to way too much warming.
http://www.vancouversun.com/technology/Celsius+estimate+climate+change+2100+study/6138445/story.html
[font size=4]World could be 5 degrees hotter by century's end[/font]
Agence France-Presse February 11, 2012
[font size=3]French scientists unveiling new estimates for global warming said the 2 C goal enshrined by the United Nations was "the most optimistic" scenario left for greenhouse-gas emissions.
The estimates, compiled by five scientific institutes, will be handed to the UN's Intergovernmental Panel on Climate Change (IPCC) for consideration in its next big overview on global warming and its effects.
The report - the fifth in the series - will be published in three volumes, in September 2013, March 2014 and April 2014.
The French team said that by 2100, warming over pre-industrial times would range from 2 to 5 C.
…[/font][/font]
How much more precision do you need before you believe action is called for?
joshcryer
(62,269 posts)Obviously I have failed.
If you think the Y scaling could be made in any way to diminish or remove the massive heat contribution, I would like to see you do so and still have a meaningful graph left over.
Nederland
(9,976 posts)Just saying...
joshcryer
(62,269 posts)Scaled to exactly 6% of what it was originally.
OKIsItJustMe
(19,938 posts)That, my friend, looks like exponential growth to me.
That is the kind of trend you don’t want working against you.
Nederland
(9,976 posts)Really? Are you honestly claiming that temperatures will grow exponentially?
If so, you are completely clueless. IPCC computer models do not predict exponential growth.
XemaSab
(60,212 posts)ice loss.
Oh wait, you're ignoring my post. I forgot. 
Nederland
(9,976 posts)OKIsItJustMe
(19,938 posts)However, if the increase were arithmetic, the trend line would be straight, not a curve.
This shouldn’t come as much of a shock. CO[font size=1]2[/font] levels also appear to be increasing exponentially.
http://scrippsco2.ucsd.edu/graphics_gallery/mauna_loa_record/mauna_loa_seas_adj_fossil_fuel_trend.html

Will you accept that the curve is a polynomial?
Nederland
(9,976 posts)IPCC computer models do not predict that future temperatures will curve upwards. That is because IPCC computer models do not derive their results from a simplistic mathematical analysis of past temperature changes or past CO2 changes. If you really understood climate change, you would understand why that is an incredibly stupid thing to do.
OKIsItJustMe
(19,938 posts)Posted by Brad Plumer at 03:49 PM ET, 11/04/2011
[font size=3]One of the small consolations of the Great Recessions was that global greenhouse-gas emissions had dipped slightly, giving the world a few years’ breathing room to figure out how to tackle global warming. But the Copenhagen climate talks fizzled, the world didn’t take advantage of the lull, and the grace period’s now over. According to new data from the Department of Energy’s Oak Ridge National Lab, global carbon-dioxide emissions just saw their biggest one-year rise, a 6 percent jump in 2010.
The striking thing is that emissions are now rising faster than the worst-case scenarios envisioned by the IPCC in its 2007 report. What would this mean for global warming? The chart on the right, from a 2009 study by MIT’s Joint Program on the Science and Policy of Climate Change, lays out the possibilities. If emissions keep growing at their current pace, then the average prediction from MIT’s modeling is that the world could heat up 5.2°C by 2100. But that’s just the average. There’s a 9 percent chance that global surface temperatures could rise more than 7°C — truly uncharted territory. And as we keep adding carbon-dioxide into the air, the odds that we’ll be able to dodge a drastic rise in temperatures become very, very low.
What would that big of a temperature leap do to the planet? Earlier this year, Climate Progress’s Joe Romm put together an excellent post going through the scientific literature on likely impacts from the IPCC’s worst-case emissions scenario. We’d be facing much higher land temperatures — as much as a 5.5°C (10°F) rise in parts of the United States — plus a six-foot sea-level rise by 2100, along with large species loss, many more extreme weather events, and a big hit to the world’s food supply. Arctic temperatures could rise as much as 11°C (20°F), which would, among other things, speed up the melting of Greenland’s ice sheet.
In any case, you can pick through the Energy Department’s emissions data here. About 41 percent of the carbon increase last year came from China, with 12 percent of the leap coming from the slowly recovering U.S. economy (overall U.S. emissions, however, are still lower than they were before the financial crisis).
…[/font][/font]
Nederland
(9,976 posts)Yes, the IPCC underestimated how fast CO2 levels would rise. However, those same CO2 level predictions that the IPCC underestimated were used by the computer models to predict future temperatures. Now logically one would expect that if the CO2 levels the models used in their calculations were too low, the temperature outputs of those model would be too low as well. Instead, we see the reverse is true--IPCC computer models have consistently predicted temperatures that were higher than those that were observed. This demonstrates just how poor the models are at this point in time, and proves beyond doubt that we do not understand climate well enough to know what the future will look like.

kristopher
(29,798 posts)You wrote:
"IPCC computer models have consistently predicted temperatures that were higher than those that were observed."
Document that claim.
OKIsItJustMe
(19,938 posts)Do you have anything to support that claim?
Nederland
(9,976 posts)There were some complaints about using a baseline of 1980-1999 for the graphs, despite the fact that that is the baseline that the IPCC used in AR4. These complaints are addressed and a whole series of graphs were created using a wide variety of baseline choices. In the end, it doesn't make much of a difference. Those discussions can be found here:
http://rankexploits.com/musings/2011/sensitivity-to-baseline-totos-question/
http://rankexploits.com/musings/2011/fruit-salad-temperature-comparisons/
http://rankexploits.com/musings/2011/more-sensitivity-to-baselines/
Nederland
(9,976 posts)I figured I would give you this in anticipation of you not approving of my choice of source. If you'd like to argue that Gavin Schmidt is a closet skeptic, I'm all ears
Here is his chart comparing Hansen's 1988 computer models:
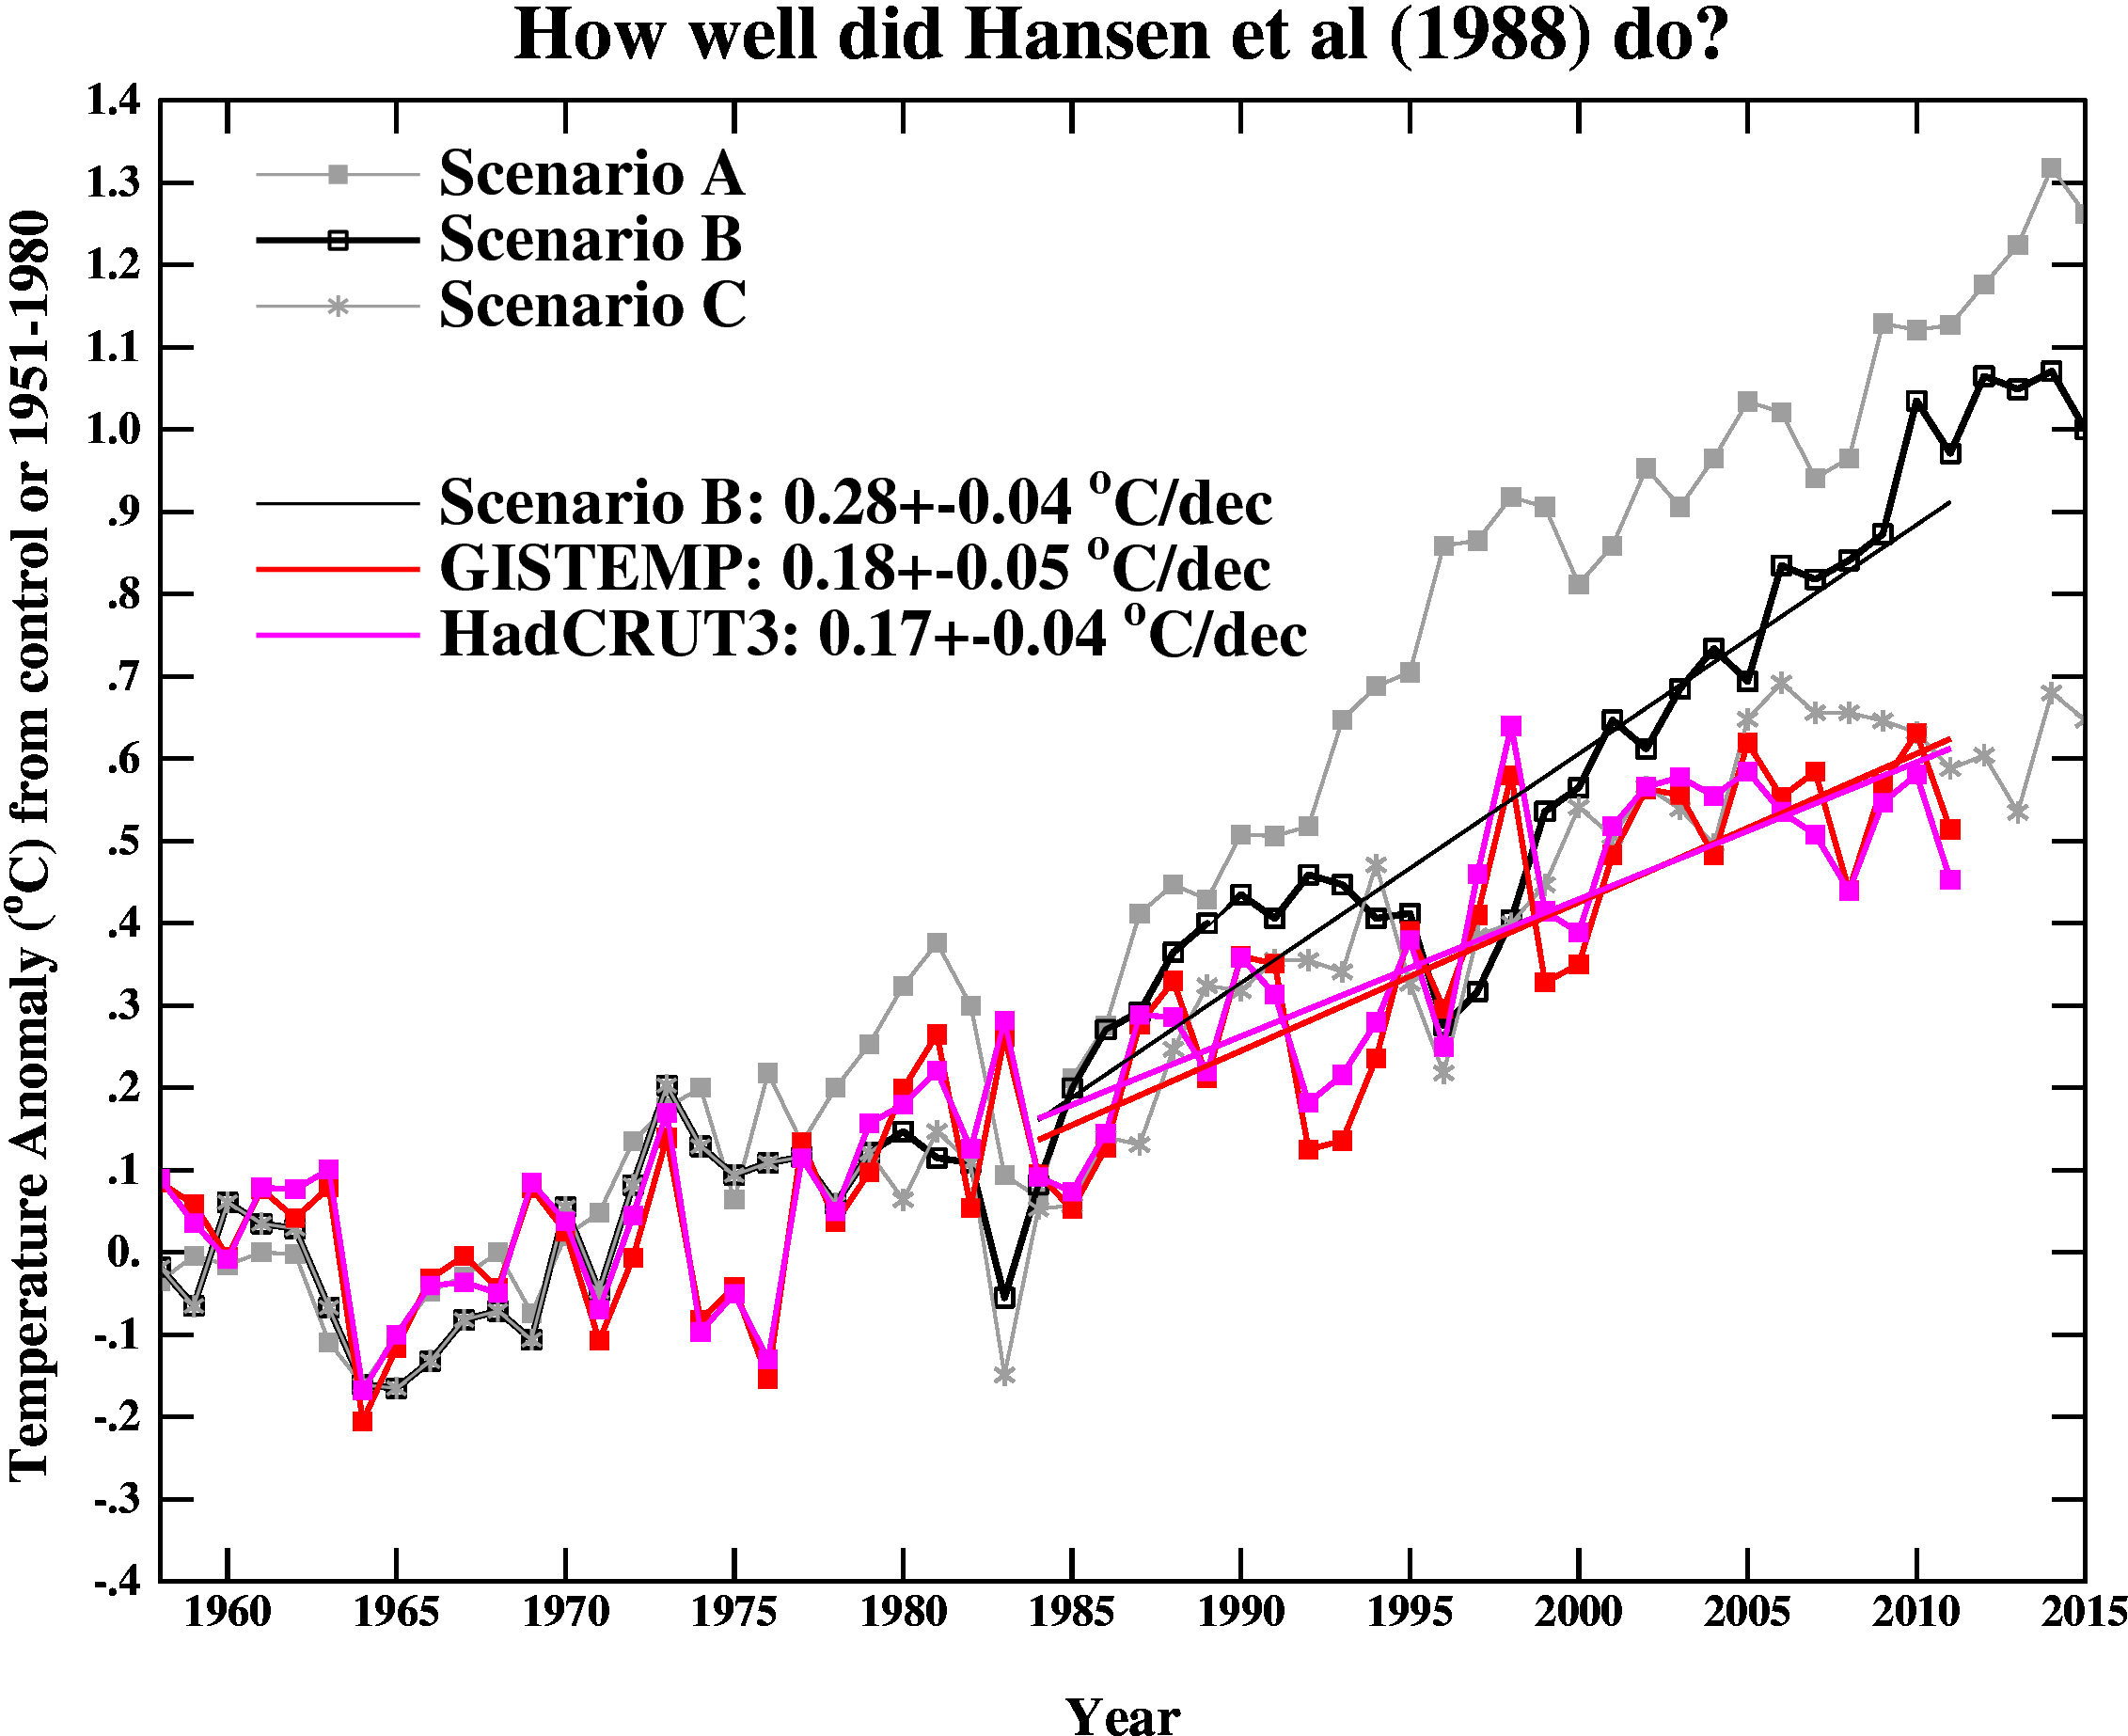
As you would expect, the model's ability to correctly predict temperature diminishes the further out you go. Hansen's description of what each scenario means is as follows:
Scenario A assumes continued exponential trace gas growth.
Scenario B assumes a reduced linear linear growth of trace gases.
Scenario C assumes a rapid curtailment of trace gas emissions after the year 2000.
Depending what is included in trace gases, Scenario A is the most accurate description of what has happened. Perhaps an argument could be made for choosing Scenario B, but one cannot plausibly claim that Scenario C occurred. Regardless, all of Hansen's prediction lines are now above observed temperatures. As time goes forward things will likely only get worse.
Here is his chart comparing AR4 models up through 2011:
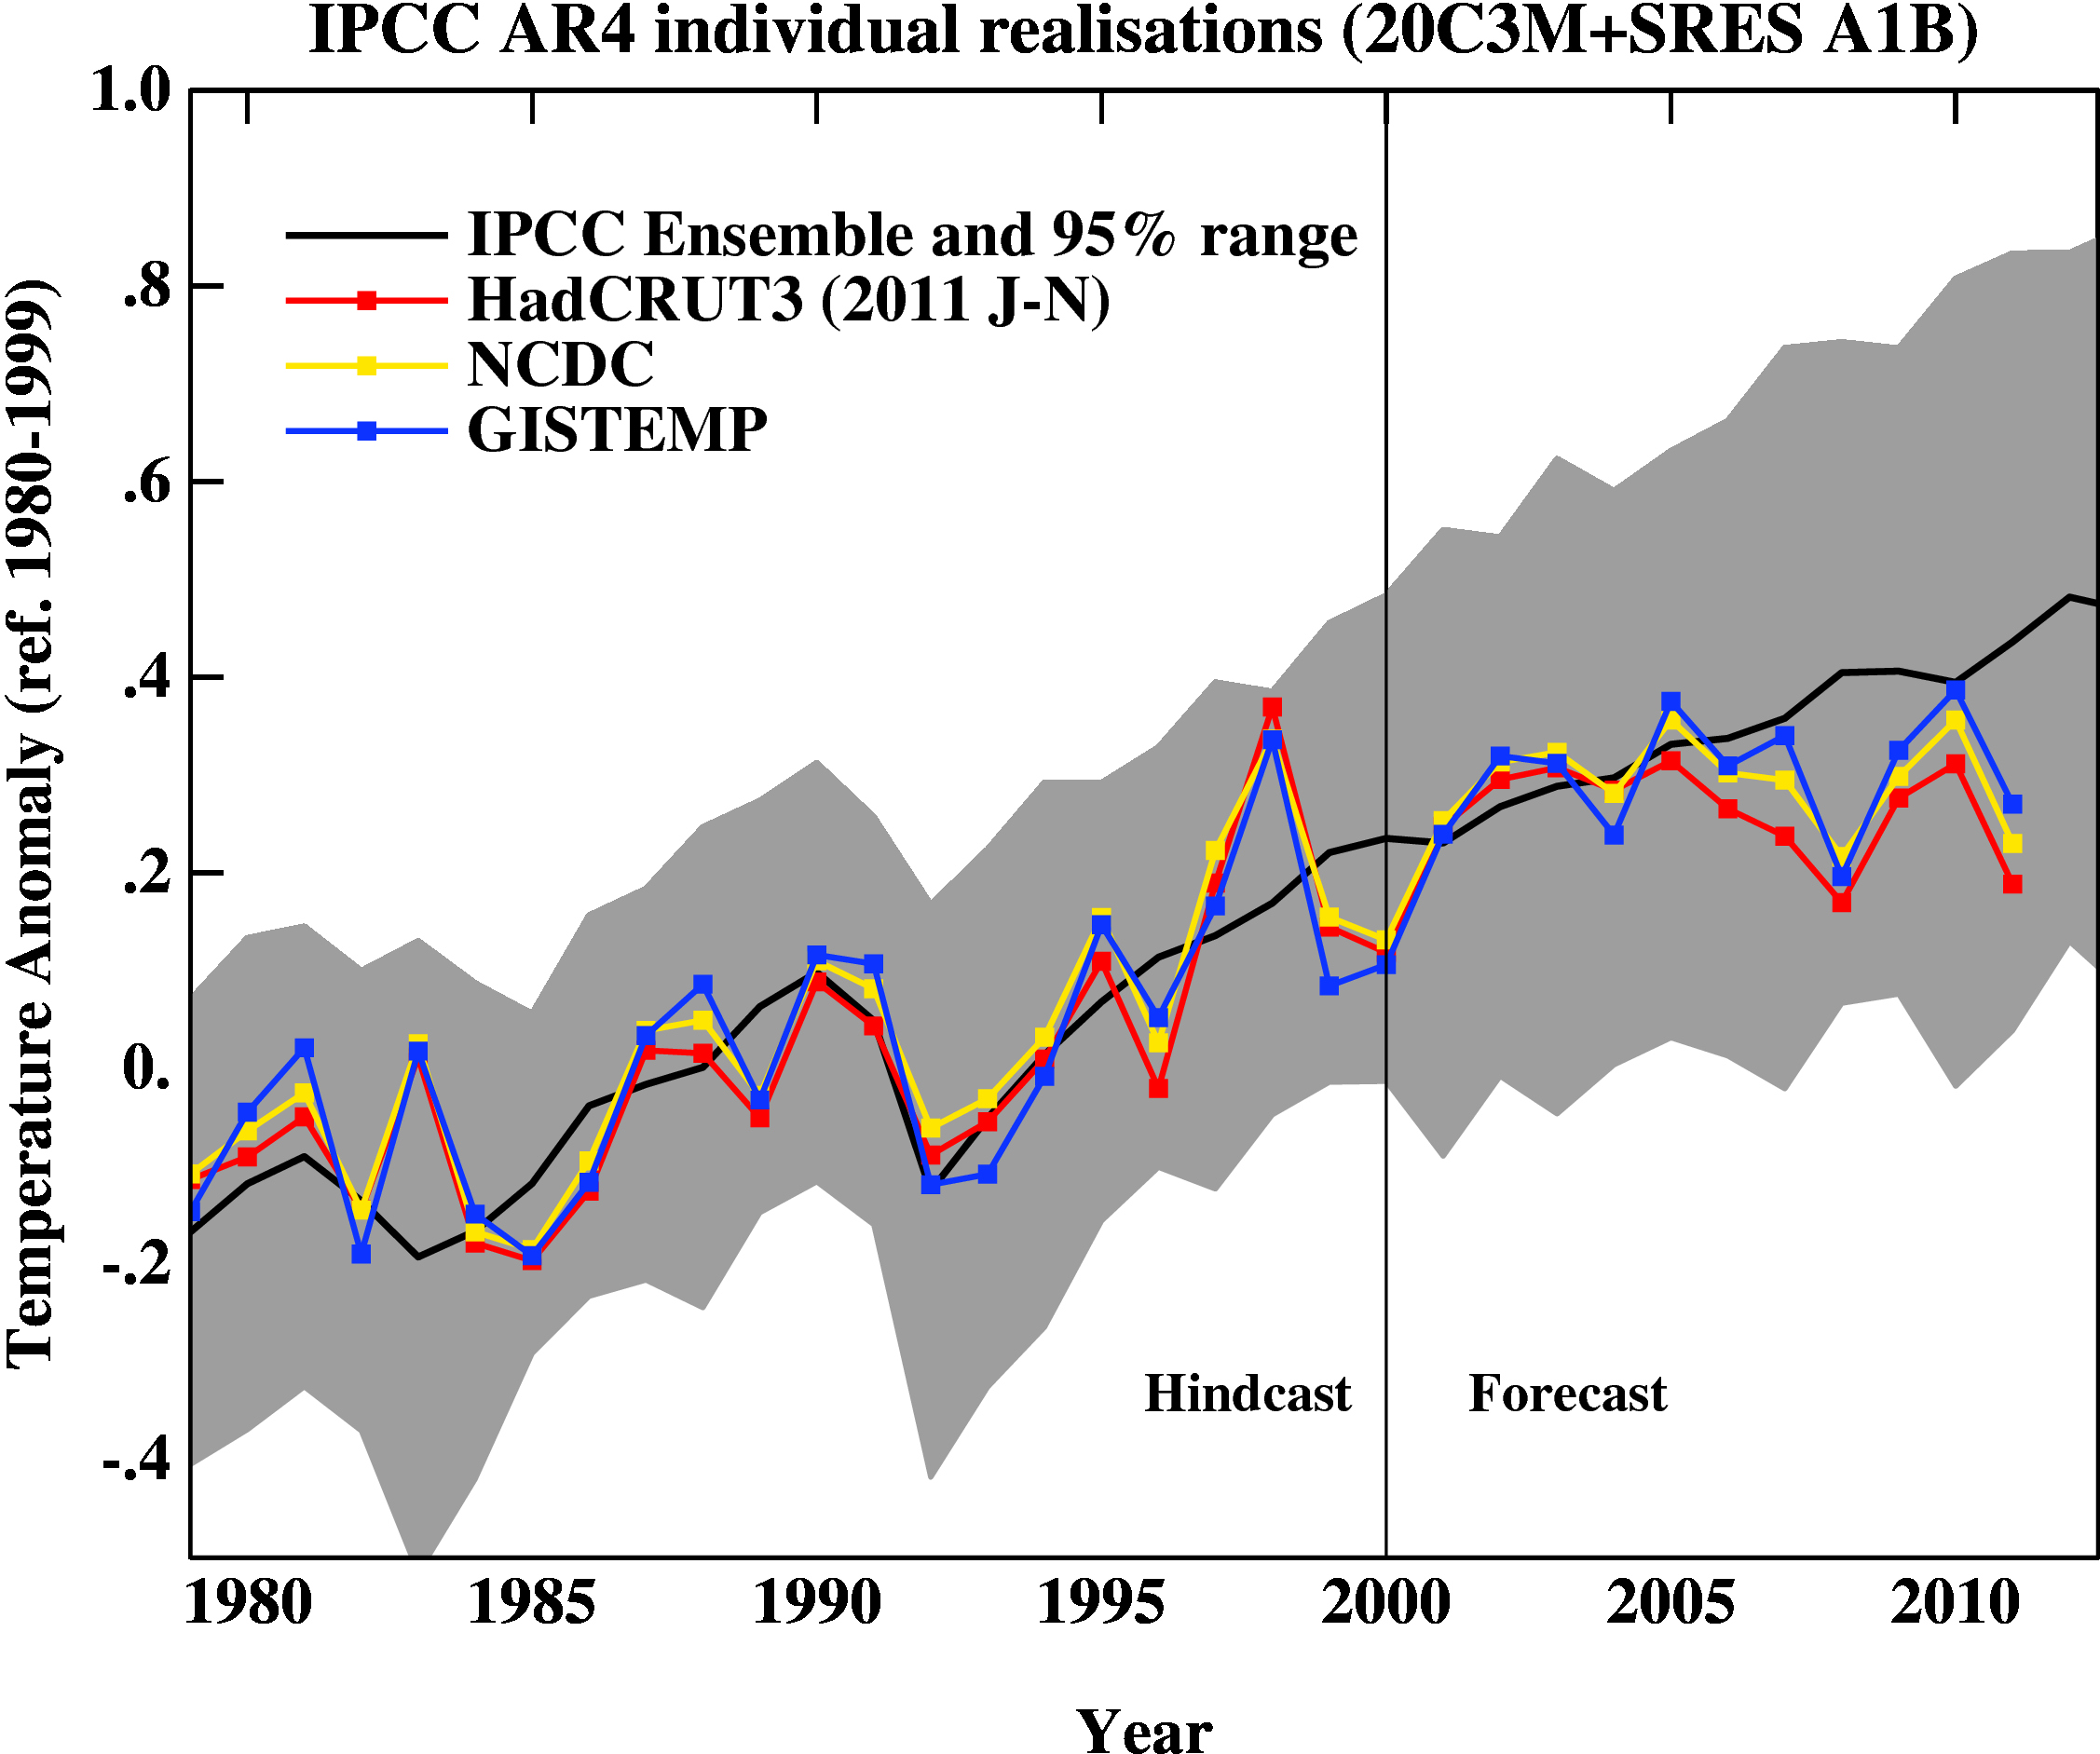
I'm not sure why the error bars on his graphs are so much larger than the ones on Lucia's, but I'm sure there will be endless discussions of which is right over the next few days (as of this posting, the RealClimate post is only two days old 2/8). Beyond the error bars though, the graphs look very similar, including the choice of baseline. The primary difference is that Lucia chose to display smoothed lines in her observed temperatures.
I would argue with Gavin's claim that everything from 2000 onwards should be considered a "forecast" simply because they used observed forcings up until 2000. What forcings were used as input data is not what is being displayed. What is being displayed is temperature, and obviously the temperatures up until 2006 were available for comparison to the modelers. The idea that modelers are such saints that they resisted the temptation to tweak their models until they matched these known temperatures fairly well is a little hard to believe. The fact that the predicted and observed temperature lines match up very well until 2006 and then suddenly diverge is a little more than suspicious.
XemaSab
(60,212 posts)They're just models. I don't think you'll find anyone here willing to die on that hill.
Meanwhile, back in 2012, the arctic sea ice is melting MUCH faster than any of the models (even as recently as a few years ago) predicted.
What needs to happen in order for you to say "Wow, this really is a problem that we need to deal with right now?"
Nederland
(9,976 posts)How about a computer model that is accurate for more than four years?
On Edit: Since you asked and I answered, what will it take for you to say "gee, maybe we are jumping the gun on this hysteria?"
XemaSab
(60,212 posts)when sea ice goes back within the 1979-1990 range and stays there for more than two years. Hell, I'll even give you 1979-2003.
Meanwhile, I think we should be doing everything possible to cut our use of fossil fuels. And no, the current toy solar projects out in the desert aren't cutting it.
So you won't accept that climate change is happening until there's a computer model that can predict it, even if Florida is under water by the time that happens?
Our computer models can't predict the weather next week, much less in 10 years.
Nederland
(9,976 posts)Do you actually care if the arctic is free of ice, or do you believe that an arctic free of ice is an indicator of worse things to come? Personally, I don't see why an arctic free of ice is a bad thing in and of itself, but you act as if it is some calamity that must be reversed.
XemaSab
(60,212 posts)The arctic ecosystem is a complex and delicate one with species such as polar bears, narwhals, walruses, beluga whales, ivory gulls, Ross's gulls, and other species dependent on the pack ice ecosystem. Some of these species will be ok without the pack ice, but some species will struggle.
I also believe that an ice-free Arctic Ocean will transform the entire arctic and regions well to the south. Every person on earth depends on the jet stream being in a particular place, and when the jet stream isn't in the right place, people and ecosystems will suffer.
joshcryer
(62,269 posts)Do you have evidence that it will fall out of the range? Or that it will be at the low end of the range? Or that it won't be at the high end of the range?
There is far too much uncertainty. I personally am looking forward to seeing what happens when we have no arctic sea ice during the summer (just 36 months or so to go).
Nederland
(9,976 posts)I email Lucia to ask her about the differences between her graph and Gavin's, in particular I asked her about why her CI range was smaller than his. This was her response:
Generally, one can chose 95% confidence intervals that are:
1) The 95% spread of all runs in all models
2) The 95% spread in model means. (Spread in model means was what the IPCC used when they actually published their forecast.)
3) A 95% spread based on the variability of model weather in a typical model.
4) A 95% spread based on a statistical model (like ARIMA) and the residuals to a linear fit in models.
I choose #2 because that is what the IPCC used. Gavin used #1 which tends to give the largest spread and has now become popular with defenders of models.
I guess it all comes down to what method you believe is the correct one--the one chosen by the IPCC or the one that Gavin Schmidt cherry picked because it gave him the best results.
joshcryer
(62,269 posts)The models are imperfect. But they did predict warming. And warming did happen.
Hansen's prediction that the warming would be distinguishable from noise by the mid 90s was remarkable to be sure.
Nederland
(9,976 posts)But again, its the rate of warming that the doomers claim will occur that I am challenging. We can argue back and forth about what the proper way to calculate CI is, but one fact is undeniable. The observed temperatures have been below the ensemble line ever since the models were released. Since the A1B ensemble line is a relatively modest one that only predicts around 2.7 degrees of warming, some of which has already occurred, I fail to see why people around here still talk about seeing 5 or 6 degrees of warming this century. Its almost like they want it to happen. Could temperatures increase so they are back above the line? Absolutely. But until that happens I'm going to state what should be obvious: claims of 5 or 6 degrees of warming are not supported by the data. If I had to bet I'd say that the same thing that happened to Hansen's predictions will happen to the AR4 predictions: they will slowly but surely turn out to be too high.
joshcryer
(62,269 posts)...your answer is what, exactly?
I do not think the models are wrong, I think they don't account for arctic cooling from sea ice reduction effectively enough.
Once the albedo is sufficiently changed over a period of time I expect much more interesting results.
GliderGuider
(21,088 posts)Or are you drawing an inference from Lucia's comment, and using that to impute a motivation to Gavin? A motive that you have absolutely no evidence for, but one that fits your own preconceptions?
Nederland
(9,976 posts)However, until we learn more, don't you think it is a bit suspicious that Gavin chose a methodology that is:
1) Different than the IPCC used when the models first came out.
2) More advantageous if your goal is to validate the models.
As far as preconceptions, I think you need to look at your own. I'm pretty sure if Lucia had chose a methodology that both different from the original IPCC methodology and helpful if you wanted to invalidate the models you would be quick to point it out.
joshcryer
(62,269 posts)Just don't be too antagonistic because he's a busy man and might just trash it.
Just sayin'. Nice fellow.
Nederland
(9,976 posts)I've had him answer questions I've asked this way before, and you are right, he is quite friendly. We'll see what he says.
FYI, my comment is #63.
kristopher
(29,798 posts)joshcryer
(62,269 posts)...for the past 3.
http://www.realclimate.org/index.php/archives/2012/02/2011-updates-to-model-data-comparisons/
I predict that once the arctic is ice free (and it will be ice free within the next 5-10 years), the temperature variance is going to go on the high side.
