NOAA, NASA, HadCRUT4 - 2010, 2005 Warmest Yrs On Record; 1998 Third-Warmest
"But warming stopped in 1998!! It stopped! It stopped warming in 1998!! Did too, Did TOO, DID TOOOOOO!!!!!!!!!!!!!"
Global temperature 2013
Filed under:
Climate Science
Instrumental Record
— stefan @ 27 January 2014
The global temperature data for 2013 are now published. 2010 and 2005 remain the warmest years since records began in the 19th Century. 1998 ranks third in two records, and in the analysis of Cowtan & Way, which interpolates the data-poor region in the Arctic with a better method, 2013 is warmer than 1998 (even though 1998 was a record El Nino year, and 2013 was neutral).
The end of January, when the temperature measurements of the previous year are in, is always the time to take a look at the global temperature trend. (And, as the Guardian noted aptly, also the time where the “climate science denialists feverishly yell [...] that global warming stopped in 1998.”) Here is the ranking of the warmest years in the four available data sets of the global near-surface temperatures (1):
EDIT
New this year: for the first time there is a careful analysis of geographical data gaps – especially in the Arctic there’s a gaping hole – and their interpolation for the HadCRUT4 data. Thus there are now two surface temperature data sets with global coverage (the GISTEMP data from NASA have always filled gaps by interpolation). In these two data series 2007 is ranked 3rd. Their direct comparison looks like this:
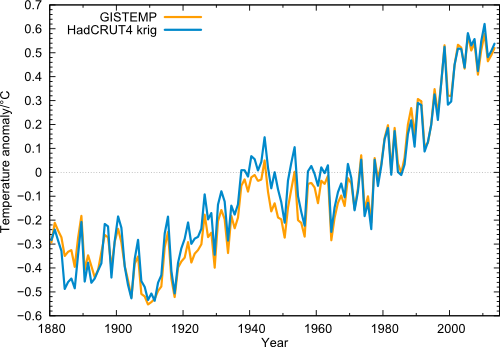
Figure 1 Global temperature (annual values) in the data from NASA GISS (orange) and from Cowtan & Way (blue), i.e. HadCRUT4 with interpolated data gaps.
One can clearly see the extreme year 1998, which (thanks to the record-El Niño) stands out above the long-term trend like no other year. But even taking this outlier year as starting point, the linear trend 1998-2013 in all four data sets is positive. Also clearly visible is 2010 as the warmest year since records began, and the minima in the years 2008 and 2011/2012. But just like the peaks are getting higher, these minima are less and less deep.
In these data curves I cannot see a particularly striking or significant current “warming pause”, even though the warming trend from 1998 is of course less than the long-term trend. Even in Nature, there was recently a (journalistic) contribution that in its introduction strongly overstated this alleged “hiatus”. It makes a good story that perhaps some cannot resist. (“Warming trend is somewhat reduced, but within the usual range of variation” simply does not make good headline.)
EDIT
http://www.realclimate.org/index.php/archives/2014/01/global-temperature-2013/