Environment & Energy
Related: About this forumGlobal Warming Trend over last 16 Years Greatly Underestimated, according to New Method
http://www.accuweather.com/en/weather-blogs/climatechange/global-warming-trend-over-last/23588938This new method shows that the Met Office in the UK, which uses the HadCRUT4 data base for global temperatures, greatly underestimated the global warming trend over the past 16 years by as much as two-and-a-half times.
Another nail in the coffin of the much-hyped "pause" in global warming.
 = new reply since forum marked as read
Highlight:
NoneDon't highlight anything
5 newestHighlight 5 most recent replies
= new reply since forum marked as read
Highlight:
NoneDon't highlight anything
5 newestHighlight 5 most recent replies

Laelth
(32,017 posts)-Laelth

CRH
(1,553 posts)as these figures are a part of the past mix of data that has supported, or not, projections of the science that has been made official in the IPCC AR4 and AR5.
One wonders, what standards, and which scientists, can be believed, in the 'published' conclusions and solutions.
Can't say I know the answer, only that, it is questionable that I have heard a comprehensive non political consensus, as of yet. Science always evolves with added knowledge, but what can be said when politics hides the true revelations of science. A question to ponder.
Or, conversely, when governments operate as they have for decades, where can the line be drawn between, corruption and BAU inefficiency?
However these thoughts, must be paranoid, governments always act in our best interest, right?.

NickB79
(19,233 posts)The consensus in the scientific community has been solid for years that global warming is real, is primarily caused by human activity, and is bound to get worse in the coming decades.
As such, there has been no threat to that consensus, especially not from studies such as these.
The consensus that IS being threatened is the one that says we can hold climate change below dangerous levels (we've ALREADY passed that threshold) and that we can manage to keep a global economy like the one we've become accustomed to working while the planet warms 3-5C over the next century.
CRH
(1,553 posts)On some things there is indeed scientific consensus, the acceptance of anthropogenic activity as a cause in the global heating.
However on other issues, some areas where we were led to believe the issue was settled science with consensus, it has been proved as otherwise. A perfect example is the 2*C level is safe meme. It was presented as a consensus of the scientific community, when in reality it was a level determined by policy makers. This was not an accidental diversion from the truth, it was intentionally sold to MSM as scientific consensus.
Much the same as the DOE pretends the science supports the levels of methane being released into the atmosphere from the oil and gas industry. But what we are finding out is those figures are being fudged and the Nat Gas bridge fuel might well be an illusion. So is there scientific consensus nat gas is better for the atmosphere or not? Obviously some scientists believe so but is it a consensus or a political illusion pretending progress?
Now we are finding the past warming figures at the Met are possibly widely off the mark when a new and validated method of calculation is used. Intentional or not, these figures have allowed the illusion of a pause in the warming to exist in the minds of many, when in fact the validity of that concept is in question now. The consensus of the scientists involved in the old calculations, and the basis for published data, appears to be wrong.
Another example is the IPCC claiming consensus supports the lineal interpretation of climate sensitivity, when geologic records suggest exponential potentials when feed backs enter into the heating of the earth system. Which is correct? More evidence daily suggests the Charney method to be underestimating, perhaps by as much or more than the suggested 2.5 times that the Met Office has undervalued heating for the past 16 years.
I am not a scientist, but it seems much of the science is anything but settled, and consensus of much of it needs to be taken with a healthy grain of salt.
Hope this explains my confusion, of what is presented as settled science or validated data, only to later find if there was consensus, then everyone was wrong.

hatrack
(59,583 posts)Global temperature 2013
Filed under:
Climate Science
Instrumental Record
— stefan @ 27 January 2014
The global temperature data for 2013 are now published. 2010 and 2005 remain the warmest years since records began in the 19th Century. 1998 ranks third in two records, and in the analysis of Cowtan & Way, which interpolates the data-poor region in the Arctic with a better method, 2013 is warmer than 1998 (even though 1998 was a record El Nino year, and 2013 was neutral).
The end of January, when the temperature measurements of the previous year are in, is always the time to take a look at the global temperature trend. (And, as the Guardian noted aptly, also the time where the “climate science denialists feverishly yell [...] that global warming stopped in 1998.”) Here is the ranking of the warmest years in the four available data sets of the global near-surface temperatures (1):
EDIT
Quality of the interpolation
How good is the interpolation into regions not regularly covered by weather stations? In any case, of course, better than simply ignoring the gaps, as the HadCRUT and NOAA data have done so far. The truly global average is important, since only it is directly related to the energy balance of our planet and thus the radiative forcing by greenhouse gases. An average over just part of the globe is not. The Arctic has been warming disproportionately in the last ten to fifteen years.
But how well the interpolation works we know only since the important work of Cowtan and Way. These colleagues have gone to the trouble of carefully validating their method. Although there are no permanent weather stations in the Arctic, there is intermittent data from buoys and and from weather model reanalyses with which they could test their method. For the last few decades and Cowtan & Way also make use of satellite data (more on this in our article on underestimated warming). I therefore assume that the data from Cowtan & Way is the methodologically best estimate of the global mean temperature which we currently have. This correction is naturally small (less than a tenth of a degree) and hardly changes the long-term trend of global warming – but if you look deeper into shorter periods of time, it can make a noticeable difference. The comparison with the uncorrected HadCRUT4 data looks like this:
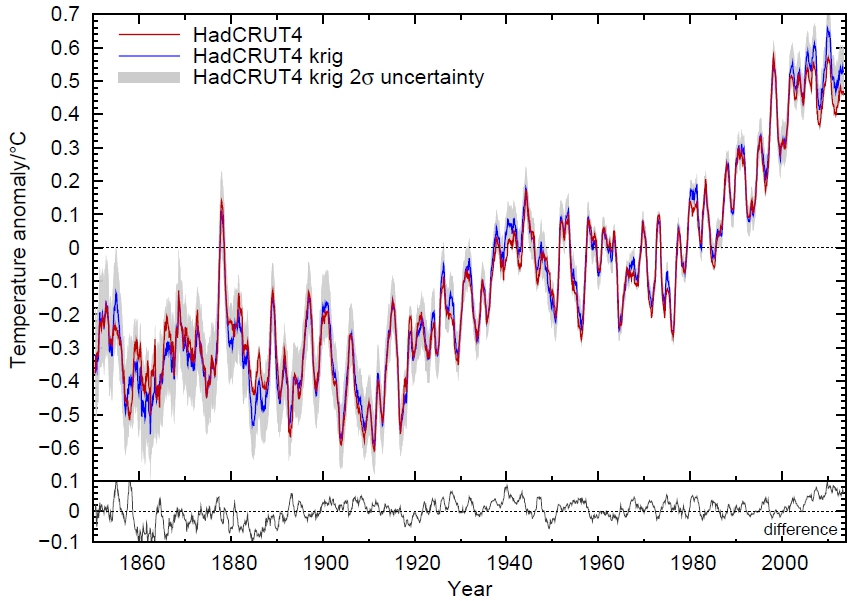
Figure 3: Comparison of interpolated and non-interpolated HadCRUT4 data, as moving averages over 12 months. Source: Kevin Cowtan, University of York.
And here’s a look at the last years in detail:
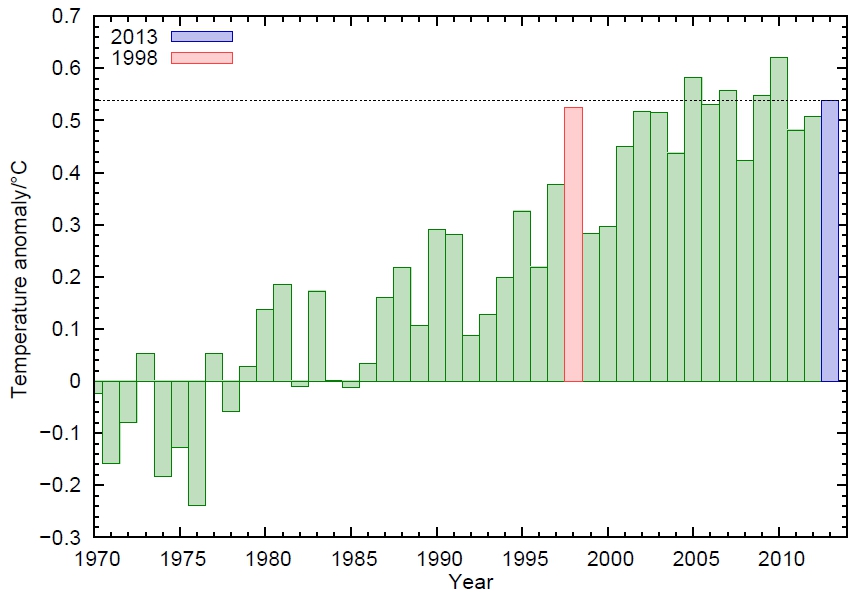
Figure 4: The interpolated HadCRUT4 data (annual average) from 1970. Source: Kevin Cowtan, University of York.
Following this analysis, 2013 was thus even warmer than the record El-Niño-year 1998.
Conclusion
In all four data series of the global near-surface air temperature, the linear trend even from the extreme El Niño year 1998 is positive, i.e. shows continued warming, despite the choice of a warm outlier as the initial year.
In all four data series of the global near-surface air temperature, 2010 was the warmest year on record, followed by 2005.
The year 1998 is, at best, rank 3 – in the currently best data set of Cowtan & Way, 1998 is actually only ranked 7th. Even 2013 is – without El Niño – warmer there than 1998.
The German news site Spiegel Online presents these facts under the headline Warming of the air paused for 16 years (my translation). The headline of the NASA news release, NASA Finds 2013 Sustained Long-Term Climate Warming trend, is thus completely turned on its head.
This will not surprise anyone who has followed climate reporting of Der Spiegel in recent years. To the contrary – colleagues express their surprise publicly when a sensible article on the subject appears there. For years, Der Spiegel has acted as a gateway for dubious “climate skeptics” claims into the German media whilst trying to discredit top climate scientists (we’ve covered at least one example here).
Do Spiegel readers know more (as their advertising goes) – more than NASA, NOAA, Hadley Centre and the World Meteorological Organization WMO together? Or are they simply being taken for a ride for political reasons?
EDIT
http://www.realclimate.org/index.php/archives/2014/01/global-temperature-2013/

pscot
(21,024 posts)We shold be parading the heads of the carbon company execs around on pick staffs. The future is looking short and pain filled.
http://truth-out.org/news/item/22002-the-march-of-anthropogenic-climate-disruption
More bad news comes from a recently published study showing that Earth's vegetation could be saturated with carbon by the end of this century, and would thus cease acting as a break on ACD. However, this study could be an under-estimate of the phenomenon, as it is based on a predicted 4C rise in global temperature by 2100, and other studies and modeling predict a 4C temperature increase far sooner. (The Hadley Centre for Meteorological Research suggests a 4C temperature increase by 2060. The Global Carbon Project, which monitors the global carbon cycle, and the Copenhagen Diagnosis, a climate science report, predict 6C and 7C temperature increases, respectively, by 2100. The UN Environment Program predicts up to a 5C increase by 2050.)
Whenever we reach the 4C increase, whether it is by 2050, or sooner, this shall mark the threshold at which terrestrial trees and plants are no longer able to soak up any more carbon from the atmosphere, and we will see an abrupt increase in atmospheric carbon, and an even further acceleration of ACD