Environment & Energy
Related: About this forumAt the IPCC: an author's view of the recent SPM negotiations for WG3 (Mitigation)
An article written by a moral philosopher who was brought into the IPCC to address ethical aspects. He gives a good summary for why the Summary for Policy Makers should be largely ignored, since it is a political document (and says that the Technical Summary is not too technical for non-scientists, like him):
Late on Wednesday evening, during a brief break, the delegates formed a huddle in the corner, trying to agree text between themselves. We, who would be named as authors of the final product, were left as spectators. The US called in a more senior delegate. The main issue was whether we should mention a ‘right to development’, as the developing countries wanted. Eventually we were presented with a few sentences that, we were told, the developed countries would reject, and an alternative few sentences that, we were told, the developing countries would reject.
As he left the room, one delegate privately advised us not to depart far from his version of the text, because his delegation was very close to deleting the whole section anyway. This was the moment when I began to enjoy the whole event. The threat was not frightening. We privately pointed out in return that, if our section was deleted, we would no longer be authors of the SPM. We would be free to go to the press and publish what we liked. Moreover, all the ethics would have been deleted from the SPM. That would be embarrassing to whoever had deleted it, since the IPCC had been making a big show of incorporating ethics into its report.
...
The biggest drama developed during the last night. The draft SPM presented to the delegates contained figures that showed emissions of greenhouse gases from countries classified by their ‘income group’. The figures showed that emissions of ‘upper medium income’ countries soared in the last decade. This is obviously important information for policymakers. It helps to explain why, despite all the anxiety about climate change, emissions have grown recently at an accelerating rate. Nevertheless, a coalition of countries led by Saudi Arabia insisted that all figures where countries were classified by income group should be deleted.
...
http://www.lrb.co.uk/blog/2014/05/08/john-broome/at-the-ipcc/
We also see that the Saudi Arabian government is evil.
 = new reply since forum marked as read
Highlight:
NoneDon't highlight anything
5 newestHighlight 5 most recent replies
= new reply since forum marked as read
Highlight:
NoneDon't highlight anything
5 newestHighlight 5 most recent replies
GliderGuider
(21,088 posts)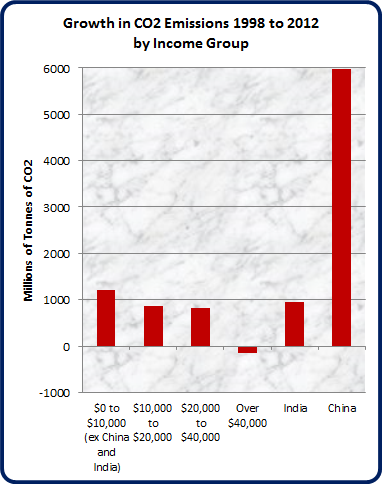
For this quick analysis I grouped nations into four income groups, and then totaled the change in CO2 emissions from 1998 to 2012 for all the nations in each group.
The national average income data (per capita GDP) is from the IMF, national CO2 data is from BP. 66 countries were included in the analysis, which is the number of individual nations whose CO2 emissions are reported by BP.
Rich nations averaged a slight decline over this 15-year period. There is little income-related difference between poor, lower and medium-income nations when India and China are taken out and treated as special cases.
For those inclined to point fingers, the culprits in AGW at this time seem to be solely China and India.

muriel_volestrangler
(101,265 posts)India's growth in emissions is about the same as the lower 3 groups you've created. But we don't know how many people are in those groups, so it's hard to know if they're comparable to India - they may be roughly similar sizes at a guess, but the real figures would help a lot.
But that's growth from 1998. It's absurd to say that you measure 'current culprits' purely from growth from an arbitrary point in time.
GliderGuider
(21,088 posts)Now, we don't know what their definition of "upper medium incomes" was, but this quick analysis doesn't appear to support that statement. The "soaring" has happened mainly in one country - China.
The reason I singled out India as well as China is that policies governing the increase or reduction of CO2 emissions are made at the national level. Per capita assessments can easily obscure rather than clarify that aspect of what's happening in the world. So while India has about the same population and per-capita CO2 growth as the aggregate of the other poor nations in my analysis, it represents a single national government. The rest of the group is represented by 20 sovereign states (aside from Chindia).
Here's the breakdown of the sub-$10,000 group:
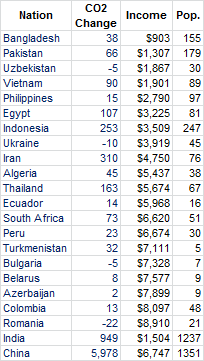
It occurs to me that in the statement about "upper medium income countries" the SPM authors may have been attempting to single out China without naming it, if an income of $6,700/year represents an upper medium income nation. That would obviously be political grounds for demanding the exclusion of the graphs.
As a final note, among the sub-$20,000 groups, all the countries that have had an outright decrease in CO2 emissions are ex-Soviet bloc nations. Economic hardship would seem to play a large role in the reduction of CO2 emissions. Probably a larger role than any national policies implemented to date.
muriel_volestrangler
(101,265 posts)From the Technical Summary, we have "When countries are assigned to income groups in this Technical Summary, the World Bank income classification for 2013 is used. For details see Annex A.II.3.", and the Annex says:
Upper Middle Income (UMC): Albania, Algeria, American Samoa, Angola, Argentina, Azerbaijan,
Belarus, Belize, Bosnia and Herzegovina, Botswana, Brazil, Bulgaria, China, Colombia, Cook Islands,
Costa Rica, Cuba, Dominica, Dominican Republic, Ecuador, Fiji, Gabon, Grenada, Hungary, Iran, Iraq,
Jamaica, Jordan, Kazakhstan, Lebanon, Libya, Macedonia, Malaysia, Maldives, Marshall Islands,
Mauritius, Mexico, Montenegro, Namibia, Niue, Palau, Panama, Peru, Romania, Saint Lucia, Saint
Vincent and the Grenadines, Serbia, Serbia and Montenegro, Seychelles, South Africa, Suriname,
Thailand, Tonga, Tunisia, Turkey, Turkmenistan, Tuvalu, Venezuela
Low income: $1,035 or less
Lower middle income: $1,036 to $4,085
Upper middle income: $4,086 to $12,615
High income: $12,616 or more
http://data.worldbank.org/news/new-country-classifications
Apparently, the figures that Saudi Arabia didn't want in the SPM were (p. 144 of the Technical Summary):
Low income countries: 1990 3.5 Gt CO2 equiv, 2010 3.4 Gt
Lower middle: 1990 5.6 Gt, 2010 7.9 Gt
Upper middle: 1990 9.8 Gt, 18.3 Gt
High: 1990 18.3 Gt, 2010 18.7 Gt
GliderGuider
(21,088 posts)Naughty, naughty IPCC.
muriel_volestrangler
(101,265 posts)so I suppose that wasn't just a simple "don't blame us" move by them, after all.