Welcome to DU!
The truly grassroots left-of-center political community where regular people, not algorithms, drive the discussions and set the standards.
Join the community:
Create a free account
Support DU (and get rid of ads!):
Become a Star Member
Latest Breaking News
General Discussion
The DU Lounge
All Forums
Issue Forums
Culture Forums
Alliance Forums
Region Forums
Support Forums
Help & Search
Environment & Energy
Related: About this forumNSIDC - October Arctic Sea Ice Extent 6th Lowest On Record For Month; Decadal Decline 6.9% For Month
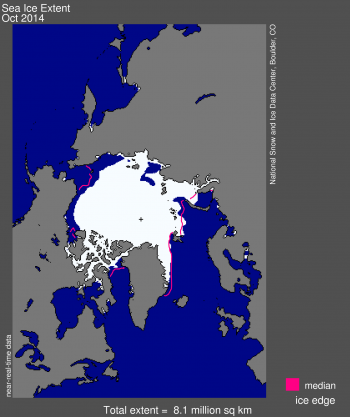
Sea ice extent in October averaged 8.06 million square kilometers (3.11 million square miles). This is 850,000 square kilometers (328,000 square miles) below the 1981 to 2010 long-term average of 8.91 million square kilometers (3.44 million square miles) and 1.29 million square kilometers (498,000 square miles) above the record low for the month observed in 2007.
Arctic sea ice extent continued to increase throughout the month of October. Ice extent in the Pacific side remains below average. Areas in the Beaufort Sea along the Canadian and Alaskan coasts, and in the Chukchi Sea along the coast of Siberia were still ice free at the end of October. The image of monthly average sea ice extent (Figure 1) shows a large polynya within the East Siberian Sea, but this area is now covered by ice. On the Atlantic side, extent remains at near-average levels.
Conditions in context
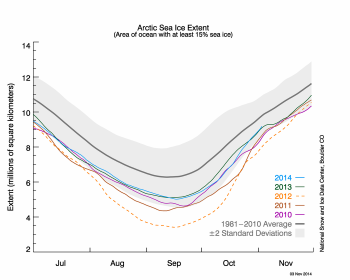
Through the month of October, the Arctic gained 3.39 million square kilometers (1.31 million square miles) of ice. This is faster than the average rate of ice gain for the month of October, but slower than the rate of ice gain seen in October 2012, after the record minimum of September 2012, and other recent Octobers.
Temperatures at the 925 hPa level show that the Arctic was 1 to 4 degrees Celsius (2 to 7 degrees Fahrenheit) higher than average everywhere, except in the Kara and Barents seas where air temperatures were 1 to 3 degrees Celsius (2 to 5 degrees Fahrenheit) lower than average. Lower than average temperatures in this region were also a persistent feature of summer 2014 and helped maintain a more extensive ice cover in the region than in recent summers.
Warm conditions were partly a result of the ocean releasing the heat gained during summer back to the atmosphere. In addition, sea level pressures were higher than average over the central Arctic Ocean and the Barents Sea, reflecting the negative phase of the Arctic Oscillation .
October 2014 compared to previous years
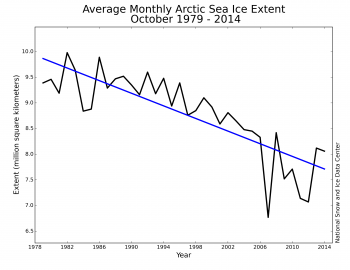
Due to the relatively rapid ice growth during October, Arctic sea ice extent for October 2014 was the 6th lowest in the satellite record. Through 2014, the linear rate of decline for October Arctic ice extent over the satellite record is -6.9% per decade.
Amplified autumn warming
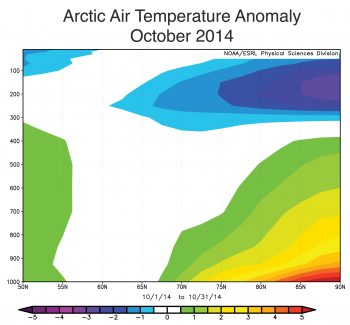
Figure 4. This figure shows average air temperature anomalies for October 2014 at each latitude from 50 North (left side of axis) to 90 North (right side of axis). The Y axis shows air pressure in millibars, indicating height above the surface.
Projections of climate change through the rest of the century show amplified warming in the Arctic compared to the rest of the planet. While there are a number of reasons for this, sea ice loss plays a strong role. With less ice in spring and summer, the upper ocean (the top 20 meters, or 66 feet) gains more heat through absorption of solar radiation. For the ocean surface to refreeze in autumn and winter, the ocean must first lose this extra heat. This is manifested as strong surface warming over the areas of sea ice loss during autumn. While the warming is greatest near the surface, the warming can extend to a considerable height in the atmosphere.
This October shows the expected pattern of amplified warmth. Warming was greatest near the surface at high latitudes (5 degrees Celsius, or 9 degrees Fahrenheit above average) and extended upwards to the 700 hPa level, roughly 3,000 meters (9,842 feet) above the surface. This pattern is similar to that observed in October 2007 and 2009. However, in other recent years the location of the warmest surface conditions shifted further south, or did not extend as far up in the atmosphere. Such variations point to the influence of other factors, including patterns of atmospheric circulation, cloud cover, and atmospheric humidity.
Arctic sea ice and the Madden-Julian Oscillation
Variations in large-scale atmospheric circulation patterns, such as the Arctic Oscillation , are known to affect the sea ice cover. These variations alter wind patterns that affect ice motion and bring in warm or cold air that influence ice melt and growth. For example, during a positive Arctic Oscillation phase, changes in the wind field help to push ice away from the coast of Siberia, allowing new ice to form and increasing the transport of ice out of Fram Strait. In the winters of the late 1980s and early 1990s, the Arctic Oscillation was in a persistent positive phase, helping to transport a large amount of thick, multiyear ice out of the Arctic through Fram Strait and leaving behind thinner ice that more easily melted the following summers.
A new study looks at the impact of a different mode of large-scale atmospheric variability, the Madden-Julian Oscillation, which appears to impact the ice cover on a shorter 30- to 90-day time scale. The Madden-Julian Oscillation is primarily driven by convection in the tropics, but causes changes in atmospheric circulation that impact the high latitudes. The impact on sea ice was found to be stronger during the winter season than in summer. It affected both the Atlantic and Pacific sectors and was confined to the marginal ice zone. The impact on sea ice also varies regionally, often showing opposing effects, such as between the Barents and Greenland seas in winter.
EDIT
http://nsidc.org/arcticseaicenews/
InfoView thread info, including edit history
TrashPut this thread in your Trash Can (My DU » Trash Can)
BookmarkAdd this thread to your Bookmarks (My DU » Bookmarks)
0 replies, 656 views
ShareGet links to this post and/or share on social media
AlertAlert this post for a rule violation
PowersThere are no powers you can use on this post
EditCannot edit other people's posts
ReplyReply to this post
EditCannot edit other people's posts
Rec (0)
ReplyReply to this post