Environment & Energy
Related: About this forumA World Temperature Projection
In this post I take a look at one possible global average temperature curve for the next 60 years, using a curve fitted to known recent temperature data. This is a very simple way of estimating future temperature rises, since it's not a "bottom up" climate modelling approach. Its weakness is that it assumes that future processes that affect the climate will be much like those of the recent past. It's strength is that it's easy to visualize and is based on well-established existing data.
I decided to use the well-accepted (in most circles, at least...) GISS dataset from NASA. For this exercise I used the annual data from 1940 to 2014. That range incorporates the modern acceleration of fossil fuel use since WW II, as well as the period since 1998 when the world system temporarily shifted to storing more heat in the oceans (the period of the famously mis-spun "pause" in global warming.) The effect of including that latter period is that the projection is somewhat more conservative than it would have been without it.
I did make one change. I applied a 10-year trailing average to the GISS data, on the assumption that year-to-year fluctuations are less significant to climate change than the underlying multi-year trend.
One has to be careful when using curve fits as prediction mechanisms. If the underlying trend on which they are based is prone to rapid, unexpected changes they can be quite misleading. Curve fitting works best for prediction in situations where the underlying trend is expected to continue into the future. The temperature trend over the period I used (1940 to 2014) has been exceptionally consistent. That was not the case earlier in our industrial history. One of my assumptions in this exercise is that the next few decades will resemble the previous few decades in terms of CO₂ emissions and the world system's response to them.
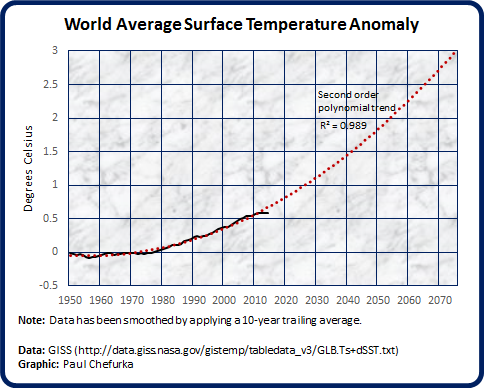
As I note on the graph, the curve used for the projection is a second-order polynomial. The R² value of 0.989 indicates that the trend curve is a very tight fit to the actual data. Mathematically, the projection seems fairly solid. Whether it turns out to actually represent reality is another matter, that I discuss below.
One important fact about the data set is that it indicates an anomaly of 0C in 1945. This tells us that the data is referenced to modern temperatures, not those of the pre-industrial era. This is important to know because these temperatures are usually referenced to pre-industrial temperatures (e.g."The world's average temperature today is about 0.85 degrees Celsius higher than it was in pre-industrial times.") If this was corrected, the projected temperatures would be about 0.3C higher than shown. I prefer the approach NASA used, because the temperature in 1945 was measured, while pre-industrial temperatures have to be estimated. On the other hand, as you can see from the graph, however, a third of a degree here or there is probably irrelevant, especially over the longer term.
Although these sorts of curve fits can be wrong on either the high or the low side, my view is there is only a very low probability that the rise will be less severe than I have shown. Three factors argue in favour of this estimate being too low.
The first is the potential for heat release from the oceans. Between 1998 and 2014 much of the added heat trapped by rising CO₂ concentrations was going into the oceans, and many climate scientists expect it to start coming back out shortly.
The second factor is that atmospheric CO₂ concentrations coming from human activity are still increasing, and in fact are growing faster than ever. Despite recent efforts to convert small parts of the world's economy over to low-carbon energy sources, the shift away from fossil fuels is going to be very gradual. Ironically, part of this is due to the fact that new low-carbon enrgy sources require high-carbon energy to manufacture in the first place. CO₂ concentrations will continue to accelerate for a number of decades.
The third factor is Arctic methane. If the methane feedback loop becomes a serious problem, then future temperature increases could be significantly greater than shown. For those who are interested, here's how the methane thing works:
- Global warming heats up the Arctic faster than more southerly latitudes, in an effect known as Polar Amplification.
- Arctic warming is releasing increasing amounts of methane that have been locked away in both permafrost and undersea methane clathrates.
- Methane is an extremely potent greenhouse gas. Measured over 20 years it is 86 times more potent than CO₂.
- However, that number only measures the effect of a "slug" of methane released into the atmosphere and then left alone to decay into CO₂ over time.
- The problem with using this value is that we do not have a single slug of methane that is released and then decays quietly until it's gone. What we have is an ongoing release of methane, that continually raises the concentration of methane in the atmosphere. In this case, the value we need to use is called the "instantaneous Global Warming Potential". The instantaneous GWP of methane is closer to 120 (or perhaps somewhat more), making a constant level of methane at least 120 times more dangerous than the same level of CO₂.
- This situation can cause what is known as a positive feedback loop: rising temperatures release methane; the methane increases the temperature still further; causing even more methane to be released. In the worst case this positive feedback loop could conceivably become self-sustaining, meaning that even if we stopped all human activity, the temperature would keep on rising until all possible methane was released.
- The reason a runaway positive feedback loop would be utterly catastrophic is the amount of carbon involved. There is about 2,000 gigatonnes of carbon locked up in methane clathrates, and about another 1,400 gigatonnes in the permafrost. This total of 3,400 gigatonnes is about 4 times greater than all the carbon currently in the Earth's atmosphere. And that doesn't count all the carbon in the oil, gas and coal we have yet to burn.
- This is why the near-term extinction folks get all hot and bothered about methane.
It looks to me as though we are locked into an eventual rise of +5C and possibly much more, no matter what we do at this point. The less action we take to reduce our carbon emissions, the greater the eventual increase. How soon that temperature increase will arrive is still uncertain. The fact that it will arrive is become more certain every day.