2016 Postmortem
Related: About this forumFun with California ballot numbers
I've been fiddling with numbers from CA to examine scenarios that could result is a Sanders win. I'm reluctant to post this because I know I'll get flamed, but I think it will be interesting to some people, so here it is.
_________________________________________________________________________
In California, the ballots that remain to be processed are mainly from people who sent their mail-in ballot very late. Older people tend to vote early, so they are over-represented in the counted votes. Younger people tend to do things at the last minute. Their votes will be over-represented in unprocessed ballots.
One scenario that would result in a Sanders' win would be if about 67% of the remaining ballots were from voters age 18 to 34 (or another demographic that skews as heavily to Sanders).
Perhaps that's outside the realm of possibility, but "just for fun," I've provided background information and calculations below.
According to the Capitol Weekly / Open California survey, voters age 18-34 broke for Sanders 78% to 22%.
The split for 35 and up can't be calculated based on the charts in the survey, but looking at the breakdown for 35-44 (Clinton 45%), 45-54 (Clinton 55%), 55-64 (Clinton 57%) and 65 and up (Clinton 65%), a 40/60 Sanders/Clinton split for voters age 35 and up wouldn't be too far off. That's what's used in this calculation.
According to the AP approximately 8.9 million voted. According to the CA SOS unprocessed ballot report, there are 2,423,607 unprocessed ballots. To estimate the number of ballots processed, subtract the unprocessed ballots from 8.9 million. The result is 6,476,393. Based on results published on the CA SOS site the number of ballots counted so far (all party primaries) is 5,629,170. If 6,476,393 were processed, and 5,629,170 counted, the rejection rate is 13%. For purposes of this calculation, a rejection rate of 15% is used (assuming the rate for unprocessed will be higher than processed).
The unprocessed ballot report includes the last time each county updated it's report. The last update for many were on 6/7, 6/8, or 6/9. This goes for some big counties. For example, the last report for San Diego, Orange, Alameda, Riverside, and Sacramento was 6/8. So, the unprocessed ballot total of 2,423,607 doesn't include mail-in ballots received between report date and deadline for receipt (6/10).
Assuming approx 3% of voters sent their ballots on 6/6 or 6/7 (to arrive 6/9 or 6/10) there would be about 250,000 late arrivals that have yet to be reported.
As reported here, 3,817,713 of the ballots counted so far are Democratic primary ballots. The total counted in all primaries is 5,629,170 (http://vote.sos.ca.gov). Therefore, 67.8% of all ballots counted were Democratic primary ballots. In the calculations below it's assumed that the same percentage of unprocessed ballots will be Democratic primary ballots.
Here are the numbers that go into the calculation. For anyone who feels like driving themselves nuts fiddling with numbers too, I've assigned variables and provided a "step-by-step" guide to make it easy to recalculate using updated reports or adjustments to the assumptions.
If you identify errors or neglected factors, let me know.
The Numbers:
C = Counted for Clinton
C = 2,128,194 a/o 6/10 report
S = Counted for Sanders
S = 1,653,416 a/o 6/10 report
99% of the Democratic primary ballots counted are allocated to Clinton and Sanders (the other 1% is distributed among other candidates)
U = Estimated unprocessed (2,423,607 a/o 6/10) plus an estimated 250,000 that arrived between last county reports and 6/10 deadline.
U = 2,673,607
M = How many votes you want Sanders to win by
M = 10,000
The Steps
Step 1. Estimate how many unprocessed are Dem primary ballots (P)
P = .687U
P = 1,836,768
Step 2. Estimate how many unprocessed Dem primary ballots will be valid (V)
V = P - .15P
V = 1,561,253
Step 3. Estimate how many valid Dem primary ballots will be allocated to Clinton and Sanders (X)
X = .99V
X = 1,545,640
Step 4. Calculate Sanders target counted ballot total for win by M votes (T)
T = (C + S + X)/2 + M/2
Using M = 10,000
T = (2,128,194 + 1,653,416 + 1,545,640)2 + 5000
T = 2,668,625
Step 5. Number of votes Sanders needs to reach target (Y)
Y = T - S
Y = 2,668,625 - 1,653,416
Y = 1,015,209
Step 6. Calculate number of valid Dem primary unprocessed that would need to come from 18 - 34 year olds (W) to give Sanders the win.
Y = .78W + .4(X-W)
1,015,209 = .76W + .4(1,545,640) - .4W
1,015,209 - 618,256 = .38W
W = 1,044,613
Step 7. Determine what percent W represents in relation to V.
W/V = Percent of valid Dem ballots that need to come from 18-34 year olds for Sanders win.
1,044,613/1,561,253 x 100 = 67%
 = new reply since forum marked as read
Highlight:
NoneDon't highlight anything
5 newestHighlight 5 most recent replies
= new reply since forum marked as read
Highlight:
NoneDon't highlight anything
5 newestHighlight 5 most recent replies
Response to pat_k (Original post)
rjsquirrel This message was self-deleted by its author.

msongs
(67,367 posts)
LenaBaby61
(6,973 posts)Okay.....
DemocratSinceBirth
(99,708 posts)
Juicy_Bellows
(2,427 posts)I'm sure your efforts will be shat upon but I for one, appreciate it. 

Squinch
(50,922 posts)You know he still loses.
And the myth of "momentum" was disproven when Hillary won California in a MUCH tighter race and still lost the primary in 2008.

pat_k
(9,313 posts)As I said in a reply below:
I'm not in the business of "proving" there is a scenario that gives Sanders a "good shot" at a win. Steep hill is an understatement. More like climbing a cliff.
But, I'd be delighted if by some miracle he did pull out a CA win. Winning by a tiny margin would make no difference in his decision about how to end his run, but it would be one for the record books. It would make it harder to ignore the fact that something very significant happened here, and that important lessons must be drawn from it if Dems are to become the powerful force economic and social justice that we can be.

Demsrule86
(68,497 posts)before California...I fail to see how it matters...but he won't win. These ballots have Gop, Hillary votes and some Bernie votes...already she has moved ahead of him. Bernie math...I want to win at any cost math.
pat_k
(9,313 posts)onenote
(42,609 posts)Last edited Mon Jun 13, 2016, 02:33 PM - Edit history (1)
It doesn't seem to impact your estimates by very much, and maybe I'm missing something, but it looks like you're assuming that 68 plus percent of the unprocessed ballots will be Democratic presidential primary ballots (based on your calculation that of 5.6 million presidential primary ballots counted 68.7 were Democratic presidential primary ballots). But just as only 5.6 million of the approx 6.5 million ballots processed were presidential primary ballots, so too must an assumption be made that a certain percentage of the unprocessed ballots are not presidential primary ballots. It gets a bit tricky because there are three categories of unprocessed ballots: uncounted mail in, provisional and "other". Assuming that the same proportion of each category are presidential primary or non-presidential primary ballots is probably inaccurate (just as it probably is inaccurate to assume that the same proportion of provisional Democratic primary ballots were cast for Sanders as the proportion of mail in ballots).
I think you've actually accounted for the fact that the unprocessed ballots include non presidential primary ballots indirectly through your "rejected" ballots adjustment. But non-presidential primary ballots (which includes ballots cast by NPP voters who did not elect to participate in any of the presidential primaries and presidential primary ballots in which the voter left the choice for a presidential candidate blank and voted only in the down ticket races) are not "rejected" ballots and given the claims that some have been making about 1 million "discarded" ballots, I think its pretty important that these matters be described clearly and accurately.
Thus, what we know is that out of the total number of processed ballots, 58.95 percent of the 6.4 million unprocessed ballots were cast for a Democratic presidential primary candidate. If that same percentage is applied to the 2.6 million unprocessed ballots, it would mean that there are around 1.53 million unprocessed votes left to be counted that will be Democratic presidential primary votes. This assumes, as noted above, that all three categories of unprocessed ballots contain the same percentage of presidential and non-presidential ballots, which may not be the case. It also assumes that none of the provisional or other votes will be rejected. If we apply a pretty conservative rate of 10 percent to the provisionals (719,000) and other (72,000) and assume 100 percent of the mail-ins will count, we can subtract 79,100 ballots from the available pool it leaves around 1.3 million, or just half, of the unprocessed ballots available for Sanders to make up a 475,000 deficit.
That means Sanders would need roughly 68% of the remaining ballots to catch Clinton.
I think these calculations, while not precise and with a number of admittedly uncertain assumptions, present a pretty accurate picture of the hill Sanders would have to climb. But if there is some glaring error here, please let me know.
Edit to fix error where I failed to distinguish between all presidential primary ballots and Democratic presidential primary ballots and subsequent errors resulting from that error.
pat_k
(9,313 posts)...when at least the reports for the big counties are up to eod the 13th. At that point, there will be no need to make any guesstimates about how many late arriving ballots aren't accounted for. Counts will also be higher. That will give us some idea if there is actually any difference in the Clinton/Sander split between the previously counted and the newly processed ballots. I hoped they would have an update Sat, but it looks like nothing will happen 'til Monday. One news report from Santa Clara said they are working all weekend. If others are doing the same, there may be substantial progress shown in next updates.
I didn't like working off the 8.9 number to get a "rejected" rate, but it was the closest thing to a grand total I could find. Any difference between total processed and total counted in primaries would capture a combo of invalidated and NPP "not primary" ballots, but figures that give a better way tease out the two types are needed. Also need an accurate total received. It may be on SOS site somewhere, but I haven't found. When they're confident all ballots meeting deadline are accounted for in the results or unprocessed reports, an accurate number for grand total received that clearly includes invalidated is likely to be reported somewhere.
When I do redo it I'll look more closely at your analysis and address points.
This is, of course, all an academic exercise. It's my way to get a handle on what's happening there. Finding more data that improves assumptions is all part of the fun. (Strange sort of recreation, but I have insomnia.)
I'm not in the business of "proving" there is a scenario that gives Sanders a "good shot" at a win. Steep hill is an understatement. More like climbing a cliff.
But, I'd be delighted if by some miracle he did pull out a CA win. Winning by a tiny margin would make no difference in his decision about how to end his run, but it would be one for the record books. It would make it harder to ignore the fact that something very significant happened here, and that important lessons must be drawn from it if Dems are to become the powerful force economic and social justice that we can be.
onenote
(42,609 posts)When corrected, the result is pretty close to yours, even if I got there via a slightly different route.
pat_k
(9,313 posts)San Bernardino and San Francisco processed some ballots. I did a spot check to see if split changed in ballots processed before 6/8 vs after 6/8
Here's the result.
County
Candidate | Processed bef 6/8 | Processed after 6/8 | bef % | aft %
San Francisco
Hillary | 85,070 | 24,158 | 55.9% | 52%
Sanders | 67,191 | 22,315 | 44.1% | 48%
Margin for ballots processed
before 6/8 - 11.8
after 6/8 - 4
San Bernardino
Hillary | 71,246 | 18,116 |57.9% | 53.1%
Sanders | 67,775 | 16,005 | 42.1% | 46.9%
Margin for ballots processed
before 6/8 - 15.8
after 6/8 - 6.2
==================
On Edit
Since last report 163,848 ballots allocated to Clinton and Sanders
Here's the split
82,947 Clinton (50.6%)
80,901 Sanders (49.4%)

ucrdem
(15,512 posts)with a 13.5% spread, an even bigger win for Clinton than the statewide 12%:
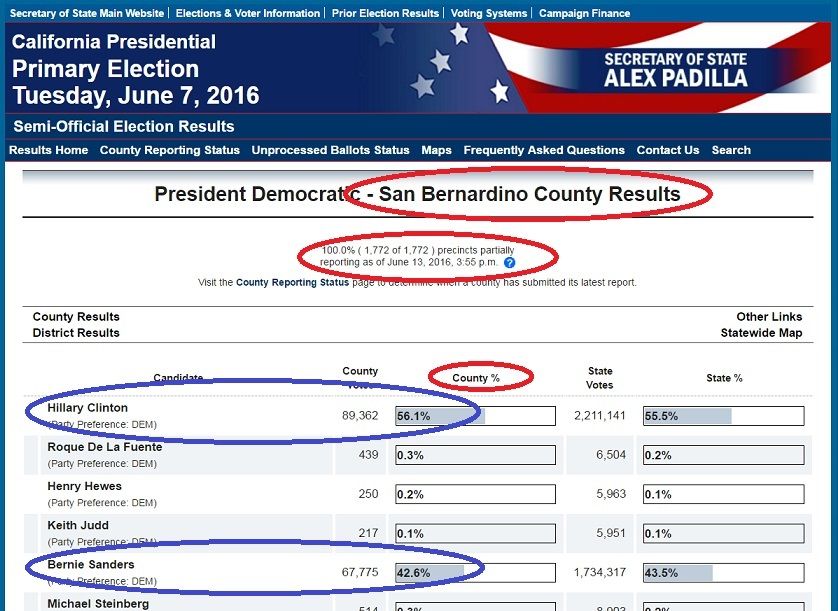
link: http://vote.sos.ca.gov/returns/president/party/democratic/county/san-bernardino/
You're right, this is fun! 
pat_k
(9,313 posts)Don't get in a twist. I'm just noting trends.
One indicator of a trend is that the split was lower in votes counted in San Bernardino between 6/8 and yesterday (i.e., 53.1 / 46.9) than the votes counted there before 6/8. Before the additional votes were processed Hillary was at 57.9 there. Same phenomenon in SF.
The difference is greater when you look at all votes processed after last report. The split in the "after" ballots is 50.6 / 49.4. Obviously he's not catching up by much in the overall, but then again there are over 2 million to go.
The "she won CA by double-digits" meme may not hold when they are finished.
And sure, "Fun with CA ballots" can be fun for anyone interested in how the numbers go. Personally, I don't stop watching returns after the AP call in any election. I like to see what the final numbers are. It's no different here. The final numbers are just coming in more slowly.
pantsonfire
(1,306 posts)This is from reddit, great links, shows the daily total of mail in votes counted by county and the running tally, I believe Sanders has moved to about 43.7% with about 10% of all the votes counted, flipping three counties in the process; though those counties were neck-in-neck.
California Vote Counting Report for June 11, 2016 self.SandersForPresident
submitted 17 hours ago * by DoctorBit
Bernie's percent of daily vote:

Estimated unprocessed ballot report: http://elections.cdn.sos.ca.gov/statewide-elections/2016-primary/unprocessed-ballots-report.pdf
Primer on California ballot types, counting and reporting: https://www.reddit.com/r/SandersForPresident/comments/4n8hlj/types_of_votes_and_vote_counting_and_reporting_in/
Bernie's trends are definitely improving. As seen in the fourth spreadsheet, three counties flipped for Bernie yesterday!
I hope you all like the new format. I believe the new spreadsheet images show trends much more clearly. I decided to post this today, since yesterday's post did not include some vote reporting yesterday that happened after 5 PM. Colour me amazed that government workers toiled away until almost 7 PM on a Friday night.
Edit: added link to estimated unprocessed ballot report
pat_k
(9,313 posts)I expected to be almost universally dismissed with "doesn't matter," "give it up," and other posts generally calling the exercise asinine. But the few recs and positive comments fulfill my expectation that some DUer's would find it interesting.
Almost didn't post it. Glad I did.
pantsonfire
(1,306 posts)pat_k
(9,313 posts)I may. Or perhaps when I redo when more data is in.
Generally I avoid reddit. I fear I'll get sucked in a spend way too much time poking around. DU is about the only place I "hang out" at periodically.
MaggieD
(7,393 posts)pat_k
(9,313 posts)MaggieD
(7,393 posts)I read the article and I think he is stunningly FOS. Yet I think that crap from him in completely in character for a white guy raised in complete privelege. He has always been that way though. Nothing new.
bhikkhu
(10,713 posts)I always appreciate people digging into the data when questions are raised.
If Bernie won California it would be a newsworthy turn of events, but the delegate counts wouldn't make a real difference. So the whole thing is "academic" at this point. I've been following the vote counting myself just out of curiosity, and so far the gap has remained pretty steady. One thing I thought of from the beginning is that if 18-34 years olds are anything like my kids, they have little interest or expertise in snail mail, so the likelihood of all the mail-in ballots being from young people might be low.
senz
(11,945 posts)Fuzziness, smoke and mirrors, is how they operate.
ucrdem
(15,512 posts)In reality the anomalies tend to cancel each other out. For example, the assumption that remaining mail-ins will skew way younger: you assume that group is most likely to be chronic procrastinators, but chronic procrastinators wouldn't mail at all -- they'd miss the last local mail pick-up (typically around 3pm) and have to vote at their polling place (which closed at 8 pm). And they wouldn't need provisional ballots if they'd already received a mail-in ballot, even if they were NPP and wanted to vote for Sanders, because those voters were given regular D ballots if they requested them. They only received provisional ballots if their name wasn't correctly listed. So the young procrastinators you're hanging your hat on would have voted at a polling place and their votes would have already been counted and included.
And so on. IOW there's not likely to be much change in the percentages and if there were anything like the whopping discrepancies your math relies on many Californians would be rightly suspicious.
pat_k
(9,313 posts)I refer you to post #10
http://www.democraticunderground.com/12512178036#post10

LiberalFighter
(50,795 posts)Even though those are apparently late ballots and likely from younger voters the age range or distribution might tend to range older. And most definitely should not have many new registrations.
It would help if the counties and state provided additional details.
pat_k
(9,313 posts)I did a little spot checking when the new report came out yesterday. The margin in the ballots processed since last report is closer, but still favors Hillary.
Since last report 163,848 ballots allocated to Clinton and Sanders
Here's the split
82,947 Clinton (50.6%)
80,901 Sanders (49.4%)
I also looked specifically at a couple "Hillary heavy" counties to see if trend held there. Result here.
One thing that makes it hard to see what's actually going on is that the reporting dates vary so much. Some are still dealing with election day ballots that got ripped or something. Others are on mail-ins; others provisionals. Last report dates by county vary from 6/8 to 6/13. If the theory is that "really" late, generally younger, people mailed on 6/6 or 6/7, their votes wouldn't have been on hand for counting until 6/9 or 6/10.
LiberalFighter
(50,795 posts)Having how many came in that were for each political party. How many are provisional. How many have been processed were counted for President, totally rejected, partially rejected, etc.
Also, why are counties with small number of unprocessed ballots not finished with them yet?
pat_k
(9,313 posts)... be waiting until all countable ballots are in. Some of the smallest numbers are from counties that haven't made a report since 6/7 or 6/8. They might have decided to wait 'til after the 6/10 deadline to process them.
They need to organize it, have everything properly witnessed, etc. Wouldn't be efficient to do that for the 30 votes left from election day, than again for the 20 that came in the next day, and the next.... better to just wait for the deadline and then put together the "count team"... I'm guessing that a number of "little places" will have sent updated reports with 0 left today (which should show up in updated statewide reports tonight).