NNadir
NNadir's JournalA Predictive Biomarker Is Found to Measure the Effectiveness of SARS-Cov-2 Vaccines.
In this post I will briefly discuss a news item in Nature, this one: Scientists zero in on long-sought marker of COVID-vaccine efficacy
I will then point to the paper it references, which should be open sourced: Khoury, D.S., Cromer, D., Reynaldi, A. et al. Neutralizing antibody levels are highly predictive of immune protection from symptomatic SARS-CoV-2 infection. Nat Med (2021).
Subtitle: Data from seven vaccination trials help to identify a blood marker for protection against the disease.
A biomarker, (or blood marker) for those who do not know, is a chemical found in tissue - often but not always blood - that indicates the presence, absence, and in some cases, the probability of a disease state. Common examples of which most people are aware are glucose levels for diabetes, A1Ac for type 2 diabetes, cholesterol, for heart disease, troponin for heart attacks, so and so on...
The discovery of biomarkers is sometimes non-trivial, and often they depend of measuring patient outcomes in clinical trials (or in epidemiological studies) along with a "shotgun" series of measurements of multiple species in a data independent setting, in the mass spec case, or, infectious diseases ligand binding "sandwich" assays which utilize receptors displayed on the surface by the offending organism or viral particle, or degradants of the particle or organism (for example qPCR type RNA tests to detect Covid.)
There are many complications in measuring antibodies, since they are protein molecules with a large nearly invariant structure, having a Y shape, with the stem of the "Y," called the Fc region, being generally completely the same for differing antibodies with different functions. Their activity is determined by a small sequence of amino acids, called the "CDR" - the complementarity determining region - found at the tips of the arms; the arms are called the Fab region. If one relies entirely on binding, one can have problems with cross reactivity, the precise nature of a CDR can be determined by a hybrid "immune capture"/digestion/mass spec approach.
Antibodies come in two flavors, neutralizing and binding - binding can represent a signaling tool - and there is considerable evidence that other factors are involved in protection or recovery from Covid, notably T-Cells. As it sounds, "neutralizing antibodies" prevent viral infection, preventing the viral particle from entering a cell; T-cells destroy the viral particles completely.
Nevertheless, the biomarker discussed in the news item focuses on neutralizing antibodies.
The news item and the motivating paper are probably open sourced, but a few excerpts first from the news item:
The study is the best attempt yet to define features of the immune response that can act as a proxy for protection against COVID-19, known as a ‘correlate of protection’, says Daniel Altmann, an immunologist at Imperial College London. “Finding the correlate of protection has really been a holy grail for this disease, as for others. It’s surprisingly hard to do.”
If researchers have a well-defined correlate of protection, they can predict from early trial data how effective a vaccine will be, says James Triccas, a medical microbiologist at the University of Sydney in Australia and a co-author of the study. This “alleviates the need to do larger, more expensive and time-consuming phase III trials”.
Triccas and his colleagues examined neutralizing-antibody data from trials of seven widely used vaccines. The team found a strong link between participants’ antibody levels recorded in early-stage trials and vaccine-efficacy results from late-stage trials. The researchers estimate that a vaccine has an efficacy of 50% even if it induces antibody levels 80% lower than those found, on average, in a person who has recovered from COVID-19.
Vaccines that generated the strongest neutralizing-antibody responses, such as the mRNA-based vaccines made by Moderna and Pfizer–BioNTech, were the most protective. Vaccines that induced a weaker response, which included the Oxford–AstraZeneca jab, provided lower levels of protection.
The researchers predict that because antibody levels wane over time, booster shots might be needed in about a year, but protection against severe disease could last many years even without them.
The findings help to explain why, despite studies showing that some variants of the SARS-CoV-2 coronavirus reduce the ability of neutralizing antibodies to block infection, most people who have been vaccinated, even with just one dose, don’t fare too badly if infected with those variants, says Altmann...
Excerpts and a few graphics suggesting when the need for booster shots will be required, from the referenced paper:
A critical challenge at present is to identify the immune correlate(s) of protection from SARS-CoV-2 infection and thereby predict how changes in immunity will be reflected in clinical outcomes. A defined correlate of protection will permit both confidence in opening up economies and facilitate rapid improvements in vaccines and immunotherapies. In influenza infection, for example, a hemagglutination inhibition (HAI) titer of 1:40 is thought to provide 50% protection from influenza infection7 (although estimates range from 1:17 to 1:110, refs. 8,9). This level was established over many years using data from a standardized HAI assay10 applied to serological samples from human challenge and cohort studies. This assay is used to predict vaccine efficacy and to assist in the annual reformulation of seasonal influenza vaccines. At present, however, there are few standardized assays for assessing SARS-CoV-2 immunity, little data comparing immune levels in susceptible versus resistant individuals, and no human challenge model11.
The data currently available for SARS-CoV-2 infection include immunogenicity data from phase 1 and 2 studies of vaccines, and data on protection from preliminary reports from phase 3 studies and from seropositive convalescent individuals (Supplementary Tables 1 and 2). Although antiviral T and B cell memory certainly contribute some degree of protection, strong evidence of a protective role for neutralizing serum antibodies exists. For example, passive transfer of neutralizing antibodies can prevent severe SARS-CoV-2 infection in multiple animal models,12,13 and Regeneron has recently reported similar data in humans14...
Since different antibody assays were utilized in different clinical trials for different vaccines, the authors developed a method of normalizing them.
They found that neutralizing antibody levels correlated well with protection from active symptomatic infection or reinfection.
Some figures from the text:
Fig. 1: Understanding the relationship between neutralization and protection.
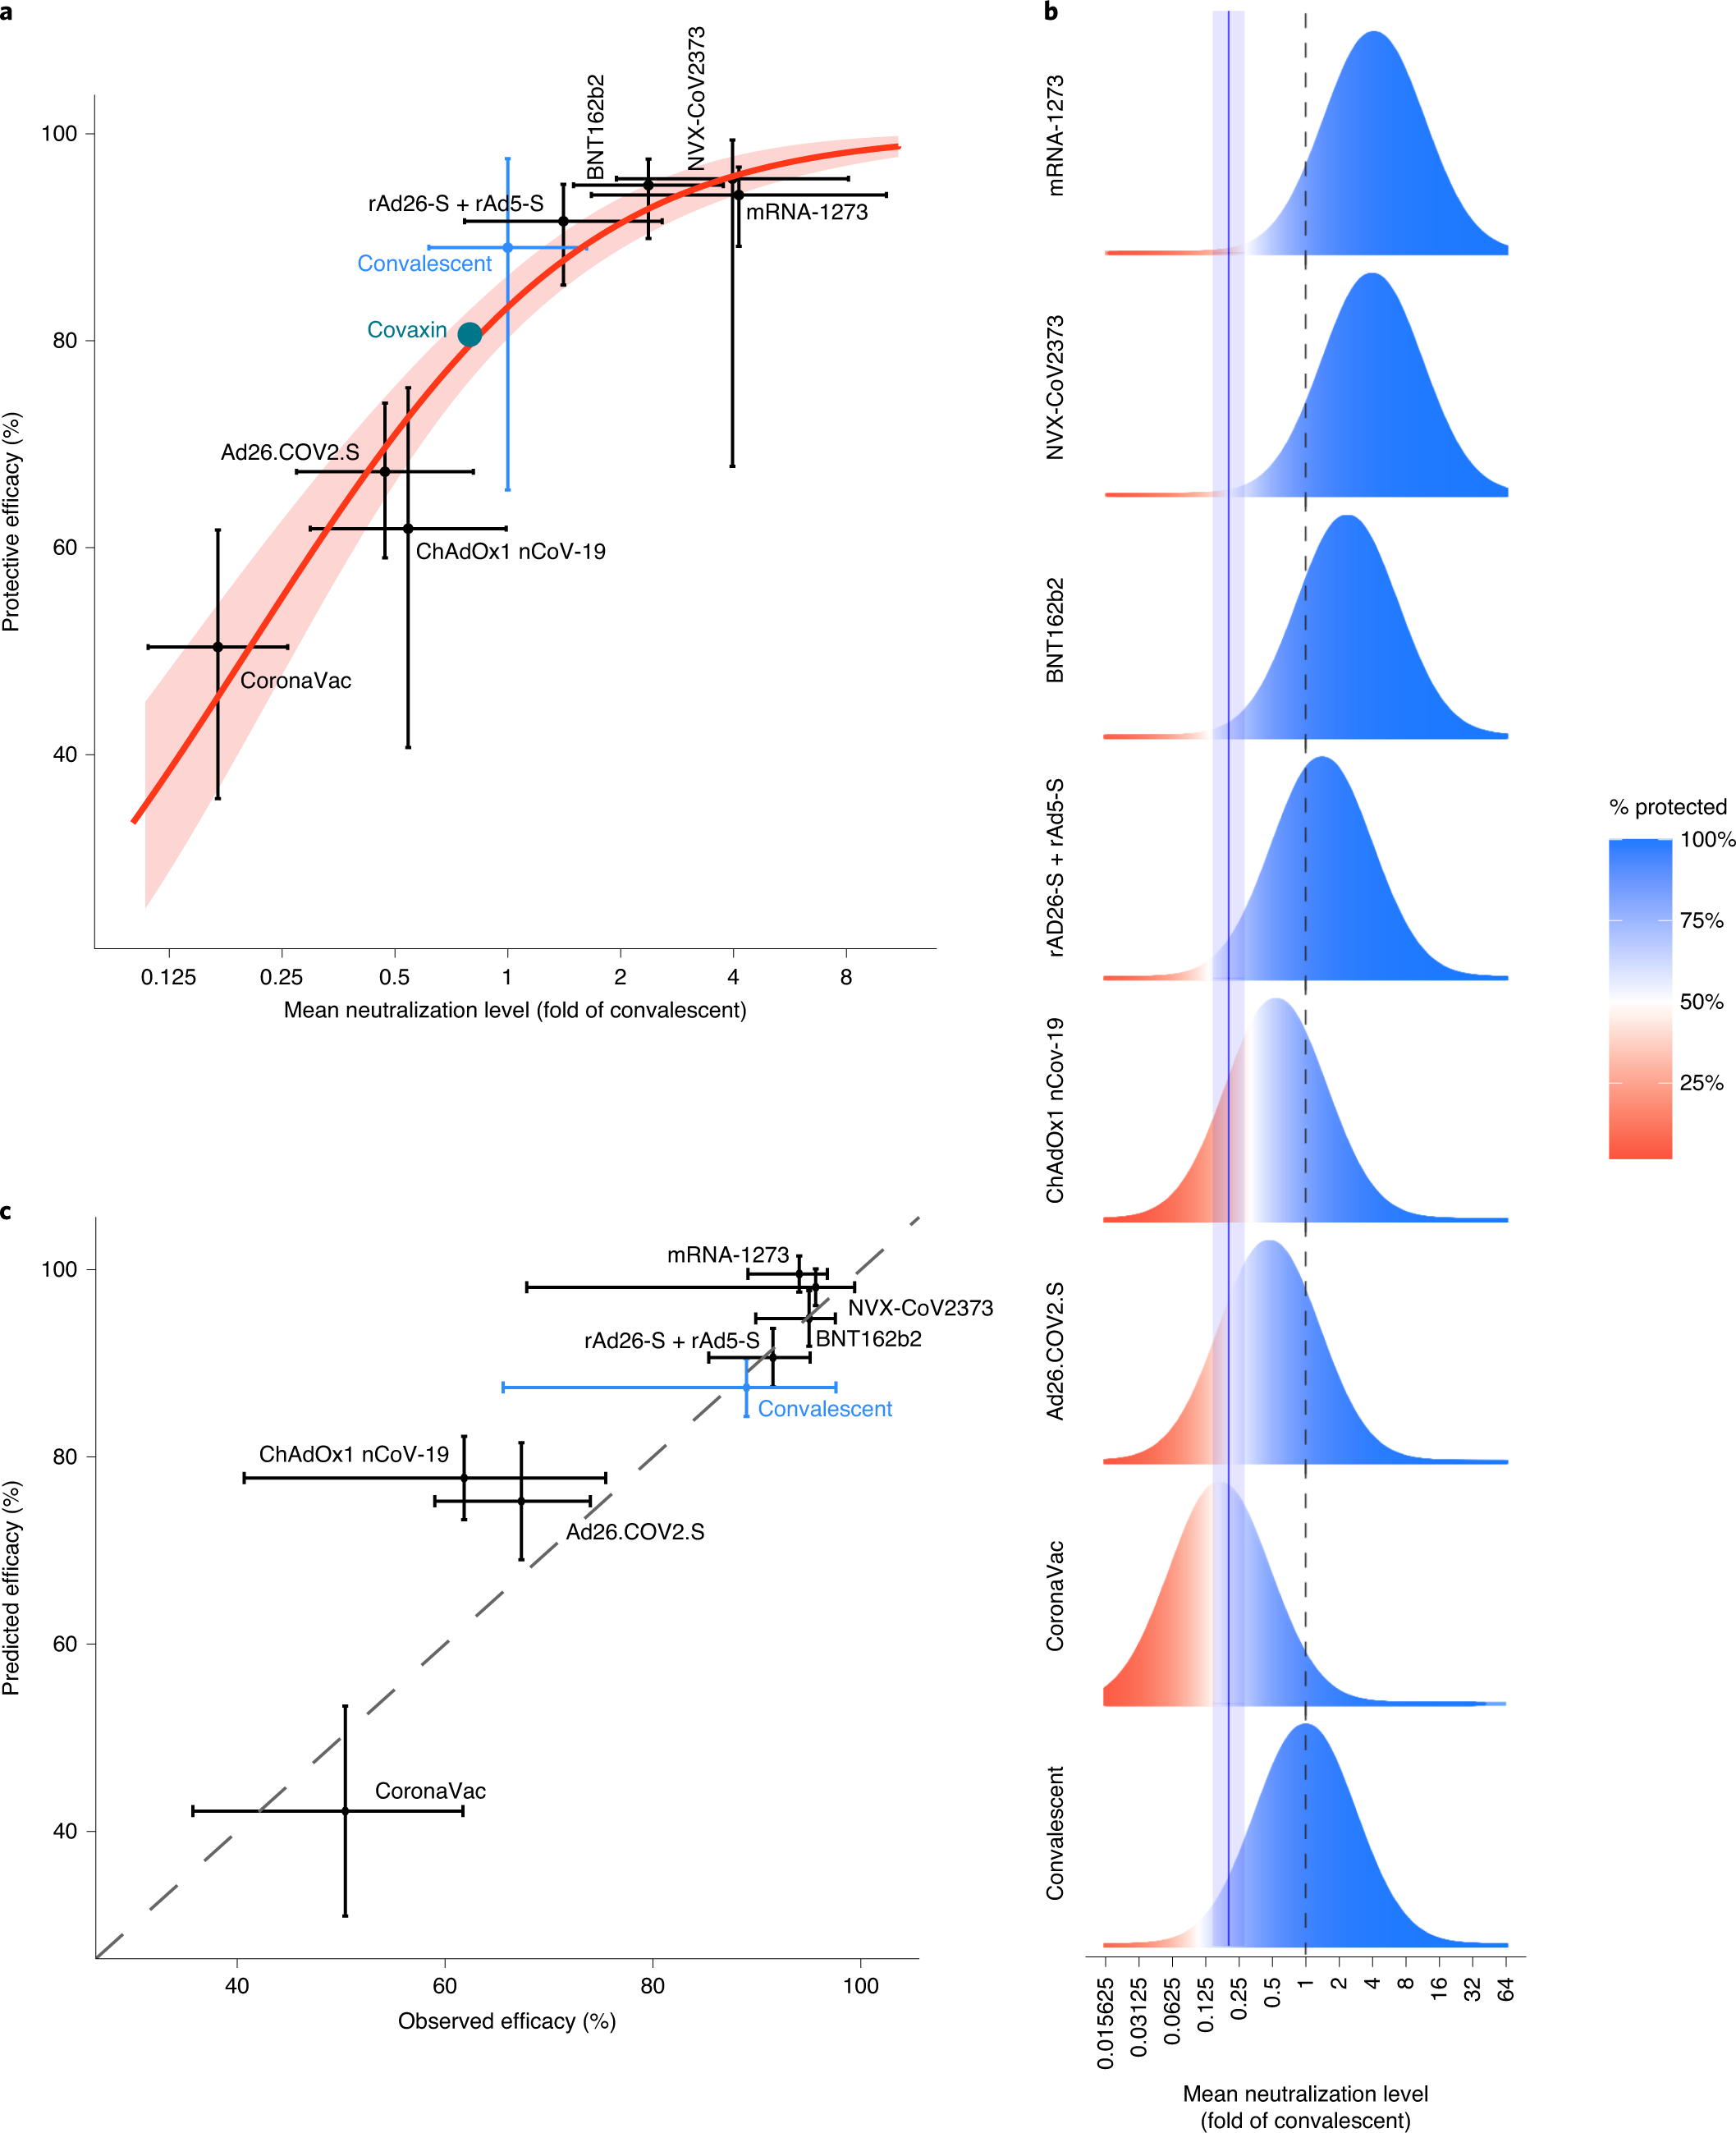
The caption:
Fig. 2: The effects of waning neutralization titer on protection.
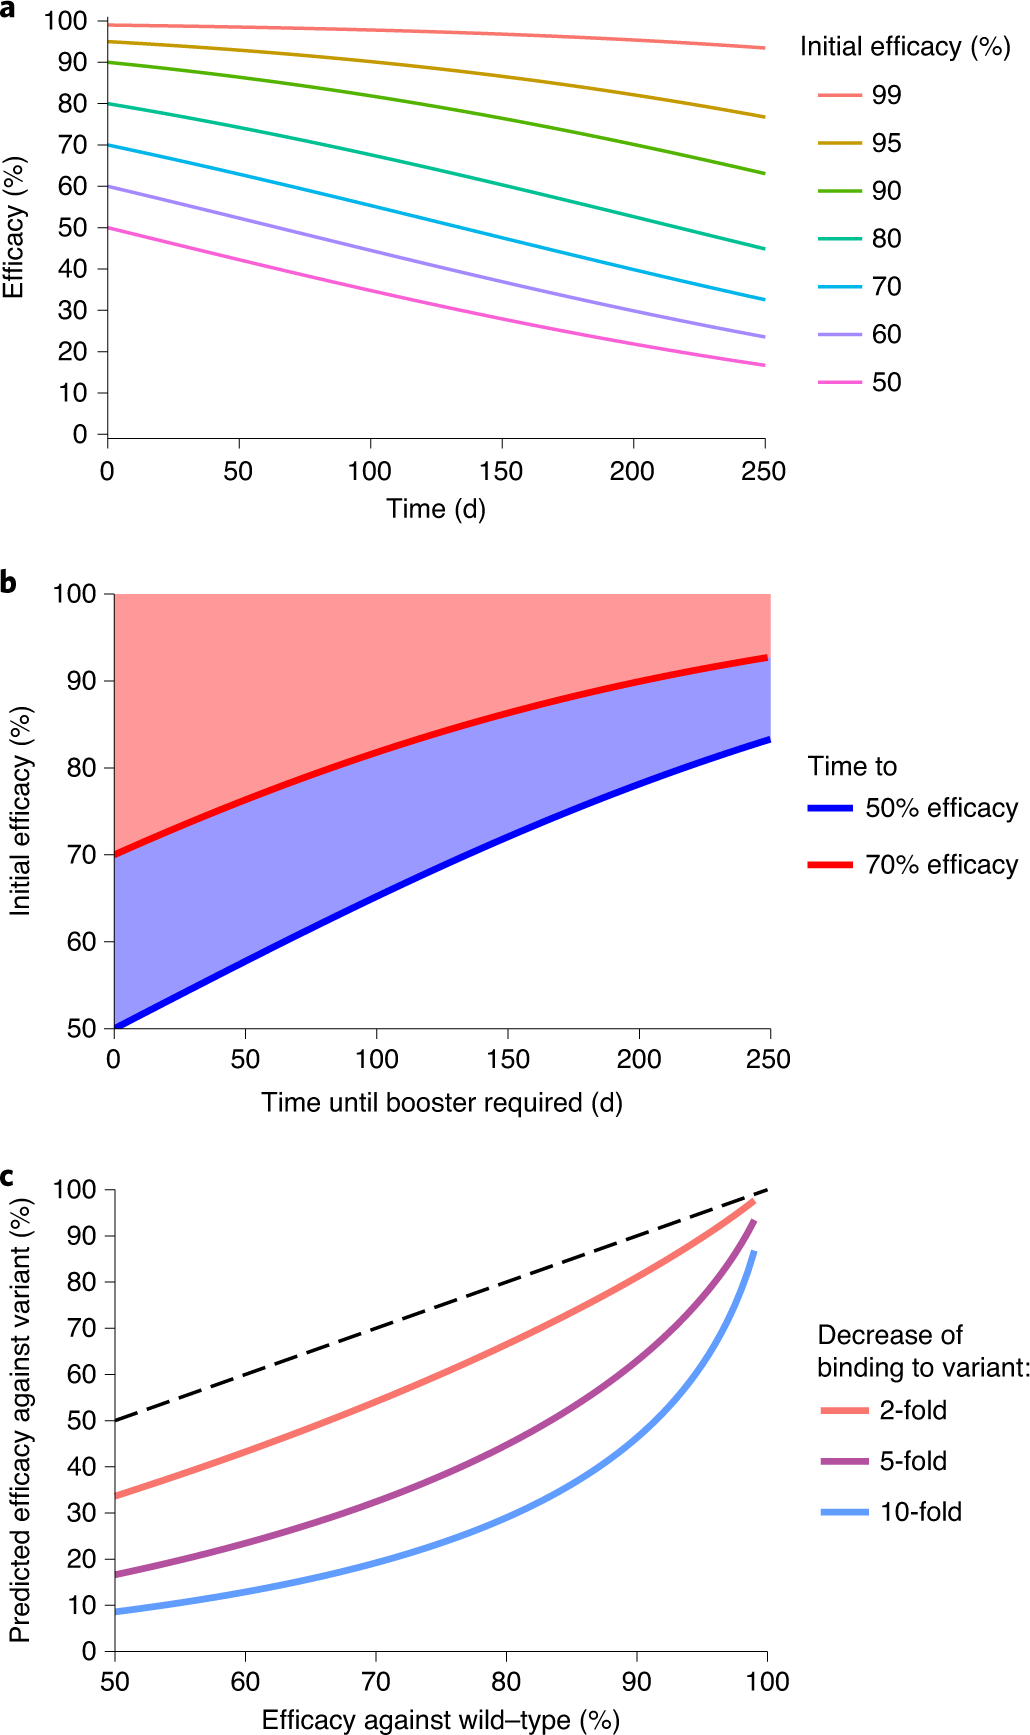
The caption:
Fig. 3: Protection from severe infection.
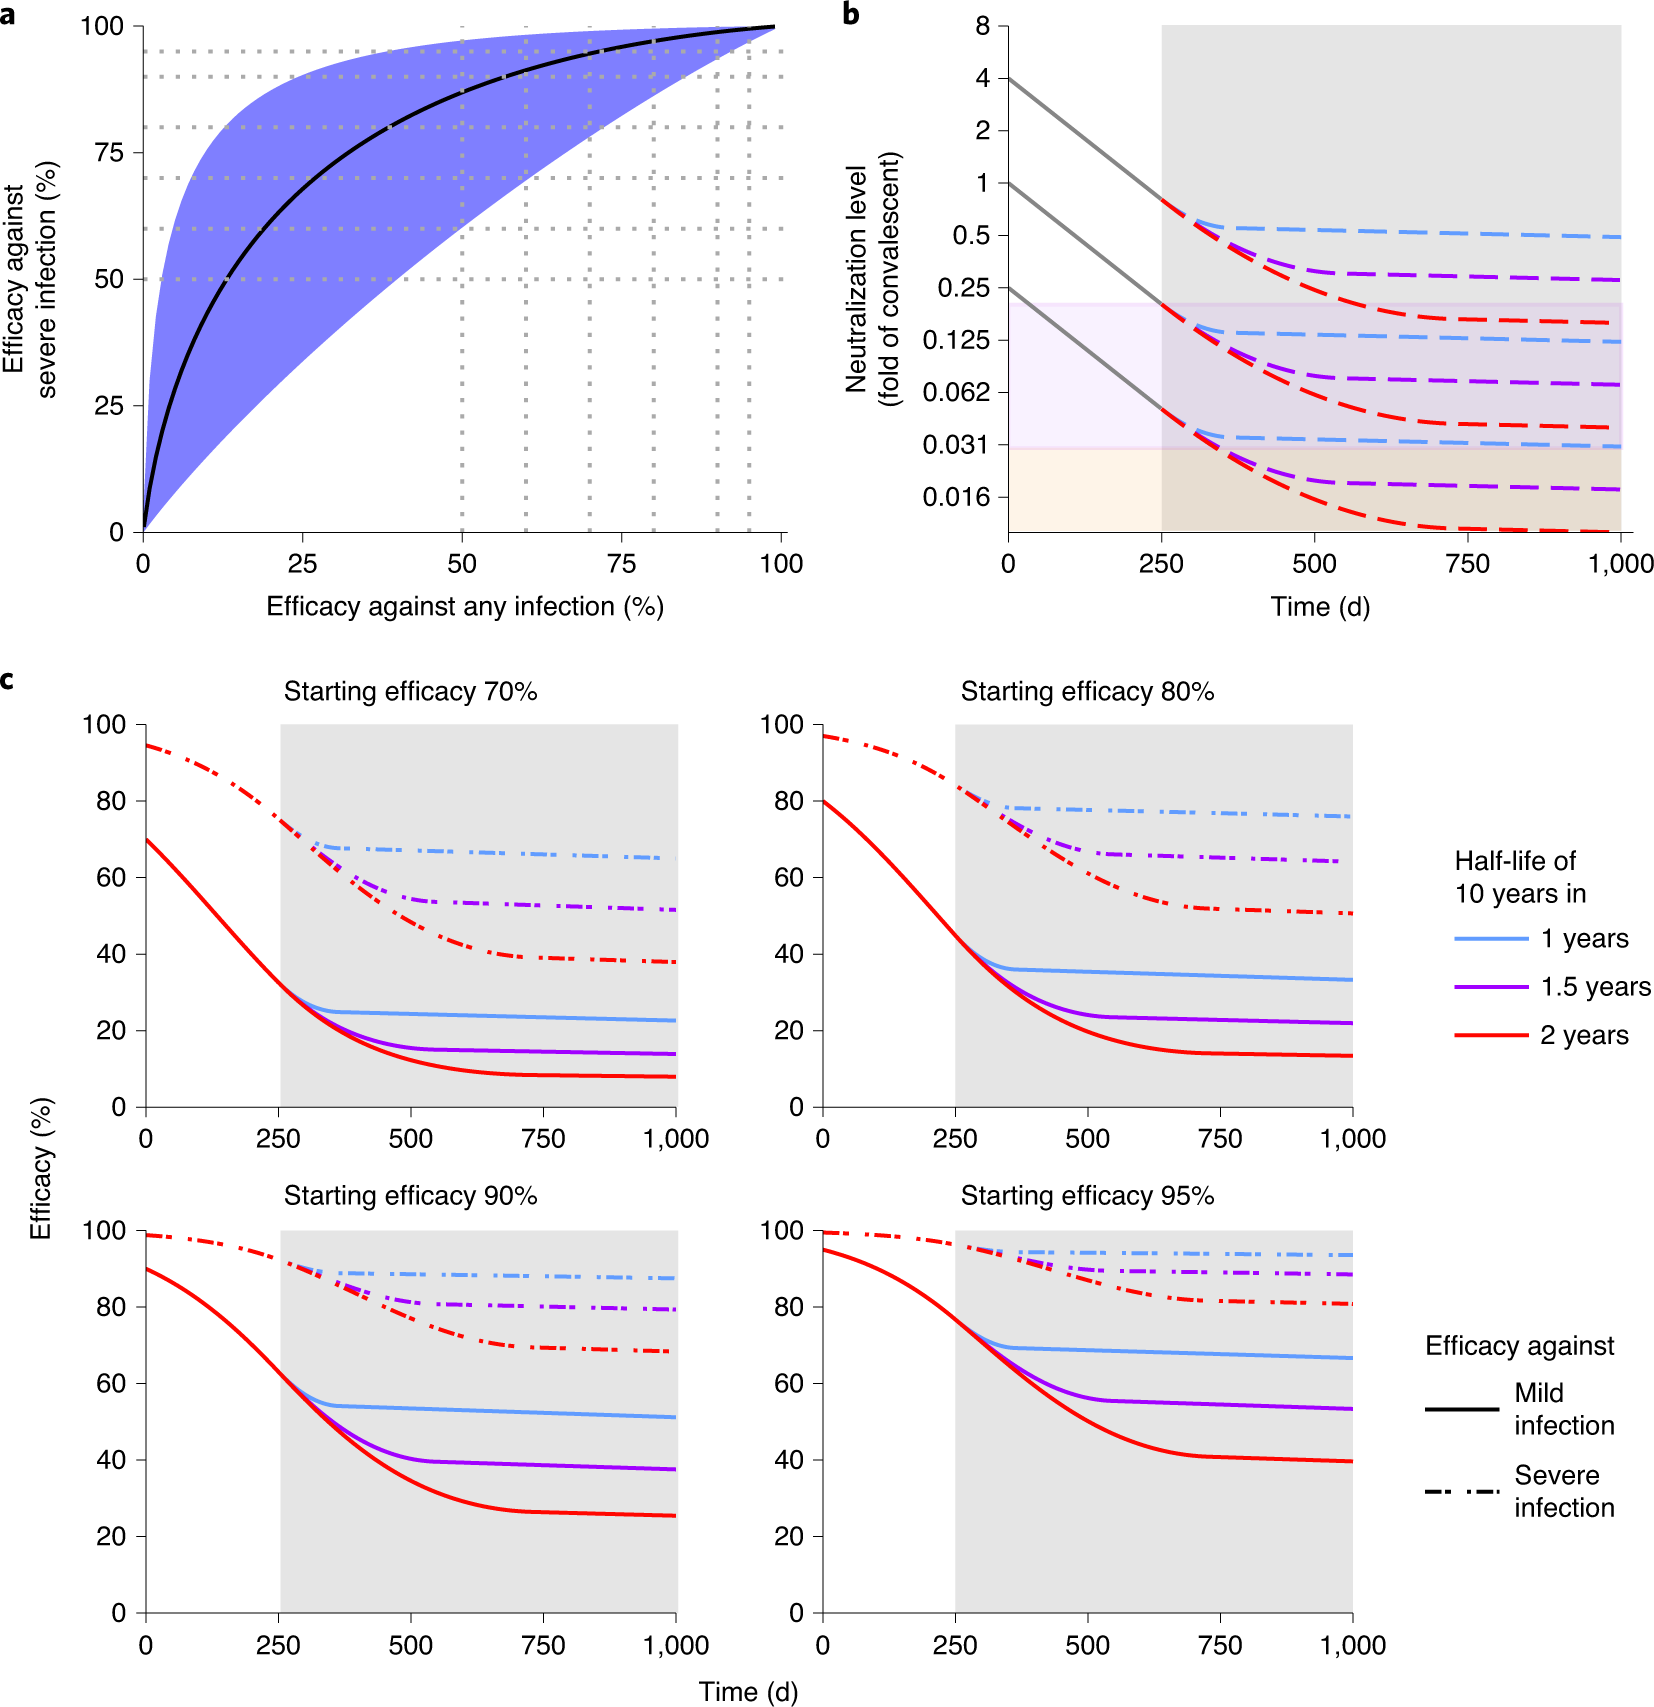
The caption:
Some additional commentary by the authors:
The scientific community deserves a pat on the back for the speed and efficiency with which they have addressed this crisis in record time, despite the rising power of ignorance, indifference, mysticism, and the wide dissemination of outright lies.
Have a safe and happy weekend.
IEA Prediction on Coal Growth as Compared to the Growth of All Renewables Combined.
Here, on the political left, we have bet the future of the planet on so called "renewable energy," to address the on going collapse of the planetary atmosphere: Nevertheless for the week beginning April 25, 2021, the average concentration of the dangerous fossil fuel waste in the planetary atmosphere, measured at the Mauna Loa observatory was 420.01 ppm, just 7 years and 11 months after it hit 400 ppm for the first time. (Week beginning 5/26/2013, 400.03 ppm, 9 years and one month after first hitting 380 ppm, 4/4/2004, 380.2).
That increase of 40 ppm took place in a little less time than I've been writing at DU. For the whole time I've been here, I've been hearing, albeit with increasing disbelief, how wonderful so called "renewable energy" is, how it's replacing nuclear energy and how we don't "need" nuclear energy. Lately there's been some after the fact lip service to how the so called "renewable energy" industry is driving the coal industry out of business.
Every year for the last 15 years or so, I've been able to download the World Energy Outlook put out each year by the International Energy Agency (IEA).
Covid has restricted some of my literature access, in particular the 2020 World Energy Outlook full report.
Nevertheless, the IEA has teasers on their websites, littered with misleading and somewhat dishonest "percent talk." If you buy access to the full report, you can find units of energy however - the unfortunate unit MTOE (million tons oil equivalent) that can nevertheless be converted to the SI unit, Exajoule (EJ).
Here's the teaser page: Global Energy Review: Key Findings.
For all those folks who keep saying "Coal is Dead" and claiming that somehow the solar and wind industry has killed it, I quote:
The bold, which to me says all I need to know about fantasy and reality, was added by me.
The primary energy production of wind and solar energy combined has never matched the primary energy production of nuclear energy, albeit obscured by the lie that a solar farm which has a theoretical peak capacity of 1 GW but might reach that power output for a few seconds on a sunny summer solstice day is the equivalent of a nuclear plant with a peak capacity of 1 GW that operates continuously at or near that power level for years at a time, without shutting down.
Constrained by fear, ignorance, selective attention, and raw stupidity, the nuclear industry has never, not once, produced as much energy as the coal industry, although for the first time, the nuclear industry has grown beyond 30 EJ per year.
After half a century of wild cheering for it, and the expenditures of trillion dollar quantities of money on it, the solar industry produces 2 EJ per year.
World energy demand as of 2019 was about 603 EJ, dominated by dangerous oil, then dangerous coal, and then dangerous natural gas, followed by the combustion of biomass. The waste from these fuels, which nobody knows how to address, kills in the form of air pollution, about 7 million people per year. It is also driving climate change, with extreme weather adding to the death toll.
Don't worry be happy.
Go join Bill McKibben's 350.org, where you can hear about losing, oh, 70 ppm in some magic "renewable energy" future. He's been prattling on year after year after year, but hasn't learned to say the word "nuclear" lest he offend one of his bourgeois contributors.
History will not forgive us; nor should it.
Have a nice weekend.
Greenhouse Gas and Health Benefits of Electric Vehicles on a Heavily Nuclearized Grid.
The paper I'll discuss in this post is this one: Health and Climate Incentives for the Deployment of Cleaner On-Road Vehicle Technologies (Laura Minet, An Wang, and Marianne Hatzopoulou Environmental Science & Technology 2021 55 (10), 6602-6612)
Many people question how I can simultaneously be an opponent of the electric car fantasy while also being an advocate of nuclear energy. This is because most people - and many nuclear energy advocates do engage in the greenwashing of electric cars - think of nuclear energy primarily as a tool for generating electricity. A conservative is, of course, a person who believes that everything should remain as it is and has been and that nothing should be tried for the first time, and thus the belief that electricity is the only possible product of nuclear energy is a conservative idea, and thus, as the world environment rapidly deteriorates at an accelerating pace, this belief is a dangerous idea.
I insist that electric cars are not sustainable for the same reason that so called "renewable energy" is not sustainable, specifically because of the high mineral mass requirement. (The IEA recently published several reports on this issue, which is slowly leaching into a conscious reality for anyone who is paying attention, albeit this with the understanding that lying to oneself is much easier than paying attention, and thus paying attention is not widely practiced.)
Nevertheless I found the paper cited at the outset to be quite interesting, not because I approve of electric cars, but because it emphasizes the reason that, despite all the attention paid to Chernobyl and Fukushima by the easily misled, nuclear energy, overall, saves lives; to wit: By the prevention of air pollution.
An electric car running in a area powered by dangerous fossil fuels - I discussed a paper in this same journal on the subject of electric vehicles in China (where there are 100 million such vehicles, albeit mostly scooters) - is merely a device for generating more pollution while wasting energy.
This study however discusses the Toronto, Canada area. Before excerpting anything connected with other aspects of the paper, before even excerpting the paper's introduction, let me excerpt this text about the generation of electricity on the grid serving Toronto as of 2016.
Only 9% of the grid depends on dangerous fossil fuels, and that is probably connected with backup of the largely useless and environmentally unacceptable wind industry. (I'm not particularly fond of hydroelectricity either; I'm a free river kind of guy.)
An "EV" is of course, an electric car, a "BEB" is a "battery electric bus."
The graphic at the outset the paper, which is available merely by clicking on the link above, which will give the abstract lays it out in terms of lives saved from air pollution, which now is killing about 7 million people per year while people carry on about Fukushima.
Here it is:

The nuclear infrastructure in Canada is almost entirely CANDU reactors, heavy water reactors, designed to run on unenriched uranium, albeit at low burn-ups. The burn-ups of CANDUs could, in theory, be extremely high, were they fueled on a ternary mixture of plutonium, depleted (or natural) uranium and thorium, or by uranium recovered from so called "nuclear waste" and thorium, and other approaches, mostly being explored in India, which also relies on heavy water reactors for clean nuclear energy.
Although a CANDU is basically a device only useful for generating electricity, I am still very fond of this reactor type and I wish we had a lot of them in the US, but we don't. They can in theory run for a very long time on the uranium component of so called "nuclear waste" in a cycle known as the "DUPIC" cycle, with the added benefit of producing significant neptunium for anti-proliferation purposes.
Anyway.
From the introductory text of the paper:
Light- and heavy-duty vehicles and transit buses constitute the majority of the on-road vehicle fleet in Canada.(8) Different approaches can be adopted to tackle their impacts on population exposure and health. Traffic management strategies (TMSs), such as congestion pricing, low emission zones, truck/bus lanes, or transit improvement, can be implemented. However, the use of TMS for improving ambient air quality is not always efficient because they can be counterbalanced by indirect effects (e.g., increased traffic volumes induced by congestion mitigation strategies and traffic diversion to different areas as a result of tolling and restrictions).(9) Therefore, such initiatives should be complemented by tackling the emissions at the source through a replacement of the existing fleet by lower-emitting vehicles. For private passenger vehicles (i.e., cars and SUVs owned by private households) and transit buses, vehicle electrification is often seen as an opportunity to decrease GHG emissions, and since electric vehicles (EVs) and battery electric buses (BEBs) do not generate exhaust emissions, electrification has also been promoted to reduce traffic-related air pollution, especially in regions with relatively clean electricity production.(10−13) For commercial vehicles (i.e., light-duty and heavy-duty), Pan et al.(14) highlighted that eliminating high-emitting trucks would bring substantial improvements in population exposure and health.
There are only few studies comparing the co-benefits of GHG mitigation strategies targeting all three fleets of vehicles. In India, Dhar and Shukla(15) quantified the changes of air pollutant emissions resulting from different policies involving sustainable technologies, fuels, and logistics for private cars, transit buses, and commercial vehicles. However, they did not quantify the implications on air quality, population exposure, and health. In the U.K., Smith et al.(16) analyzed the co-benefits and conflicts associated with measures aiming for a reduction of the carbon budget of the country, but the strategies incorporated in the scenario studied were broad and encompassed measures that went beyond improvements of vehicle fleets.
In this study, we applied an integrated framework combining a traffic assignment model with an air quality model to evaluate the health implications of a series of transportation scenarios designed by a panel of sustainable transportation experts in the context of the Greater Toronto and Hamilton Area (GTHA), the largest metropolitan area of Canada...
The methods utilized by the authors:
The scenarios:
...Scenario 1 (S1—100% EV) assumes an electrification of the private passenger vehicle fleet;
Scenario 2 (S2—100% BEB) assumes an electrification of the transit bus fleet;
Scenario 3 (S3—cleaner trucks) assumes that trucks older than 8 years have recently been renewed. The rationale behind this choice is that most scrappage programs are for vehicles of that age; few target trucks, but those for private passenger vehicles implemented in Europe are usually applicable for vehicles older than 8–10.(20,21)...
Some graphics describing their findings:

The caption:

The caption:

The caption:

The caption:
Discussing the lives saved (or in this case potentially saved) by nuclear energy is not as sexy as getting a wedgie in one's underwear worrying about critical zones in the wreckage of the Chernobyl reactor, but if we were serious - and we're not, as we hit 420 ppm of CO2 in the planetary atmosphere this year while literally Quixotically genuflecting endlessly at wind turbines - it would matter that overall, nuclear energy saves lives.
In the conclusion the authors, in a clear burst of honesty reflecting the (huge) caveat write this:
To conclude, this analysis highlights the necessity to tackle the emissions from all categories of vehicles: private passenger vehicles because they are important sources of GHG emissions and responsible for substantial social costs related to air pollution exposure; commercial vehicles because they are responsible for more than half of the YLL and premature deaths attributed to traffic-related air pollution exposure in the GTHA; and transit buses because they are operating in densely populated areas and their emissions have therefore higher health impacts in proportion.
I have added the bold in the above excerpt.
I don't know if this will inspire anyone to light a candle in one of the many temples for worshipping Elon Musk. I have no use for the guy, but feel free to do so if so inspired by this interesting paper.
I hope you will have a pleasant and safe day tomorrow.
A little Godwin type history.
Hitler destroyed the Weimar democracy using means that we're legal under the Weimar constitution.
The White Supremacy Party, misidentified as the "Republican" Party, like the consumate racist preceeding them, are now engaged in a similar effort to destroy and overthrow the American democracy, the same way, legal obstructions and overt lies.
History will surely judge McConnell, Trump and Putin as they succeed in destroying country severely, but frankly, Hitler himself was unaffected by his historic reputation.
This is an old playback, and they're using it.
First nuclear detonation created 'impossible' quasicrystals
A news item from Nature, it's probably open sourced:
First nuclear detonation created ‘impossible’ quasicrystals
Their structures were once controversial. Now researchers have discovered quasicrystals in the aftermath of a 1945 bomb test.
Davide Castelvecchi, Nature News, May 17, 2021
Excerpts:
The previously unknown structure, made of iron, silicon, copper and calcium, probably formed from the fusion of vapourized desert sand and copper cables. Similar materials have been synthesized in the laboratory and identified in meteorites, but this one, described in Proceedings of the National Academy of Sciences on 17 May, is the first example of a quasicrystal with this combination of elements1.
Impossible symmetries
Quasicrystals contain building blocks of atoms that — unlike those in ordinary crystals — do not repeat in a regular, brickwork-like pattern. Whereas ordinary crystal structures look identical after being translated in certain directions, quasicrystals have symmetries that were once considered impossible: for example, some have pentagonal symmetry, and so look the same if rotated by one-fifth of a full twist.
Materials scientist Daniel Shechtman, now at the Technion Israel Institute of Technology in Haifa, first discovered such an impossible symmetry in a synthetic alloy in 1982. It had pentagonal symmetry when rotated in each of various possible directions, something that would occur if its building blocks were icosahedral — that is, had a regular shape with 20 faces. Many researchers initially questioned Shechtman’s findings, because it is mathematically impossible to fill space using only icosahedrons. Shechtman ultimately won the 2011 Nobel Prize in Chemistry for the discovery.
At around the same time, Paul Steinhardt, a theoretical physicist now at Princeton University in New Jersey, and his collaborators had begun to theorize the possible existence of non-repeating 3D structures. These had the same symmetry as an icosahedron, but were assembled from building blocks of several different types, which never repeated in the same pattern — thus explaining why the mathematics of symmetrical crystals had missed them...
...‘Slicing and dicing’
In the aftermath of the Trinity test — the first ever detonation of a nuclear bomb, which took place on 16 July 1945 at New Mexico’s Alamogordo Bombing Range — researchers found a vast field of greenish glassy material that had formed from the liquefaction of desert sand. They dubbed this trinitite.
The plutonium bomb had been detonated on top of a 30-metre-high tower, which was laden with sensors and their cables. As a result, some of the trinitite that formed had reddish inclusions, says Steinhardt. “It was a fusion of natural material with copper from the transmission lines.” Quasicrystals often form from elements that would not normally combine, so Steinhardt and his colleagues thought samples of the red trinitite would be a good place to look for quasicrystals .
“Over the course of ten months, we were slicing and dicing, looking at all sorts of minerals,” Steinhardt says. “Finally, we found a tiny grain.” The quasicrystal has the same kind of icosahedral symmetry as the one in Shechtman’s original discovery.
Cardiac Muscle Patches Engineered w/Human Induced-Pluripotent Stem Cell Improve Infarct Recovery.
The paper to which I'll point in this brief post: Large Cardiac Muscle Patches Engineered From Human Induced-Pluripotent Stem Cell–Derived Cardiac Cells Improve Recovery From Myocardial Infarction in Swine (Ling Gao, Zachery R. Gregorich, Wuqiang Zhu, Saidulu Mattapally, Yasin Oduk, Xi Lou, Ramaswamy Kannappan, Anton V. Borovjagin, Gregory P. Walcott, Andrew E. Pollard, Vladimir G. Fast, Xinyang Hu, Steven G. Lloyd, Ying Ge, and Jianyi Zhang Cirulation 2018;137:1712–1730)
This week it was my privilege to attend an online lecture By Dr. Ying Ge, of the University of Wisconsin. I was drawn to the lecture because of her use of a Bruker 15 Tesla FT-ICR mass spec, and the related Bruker TIMS-TOF instrument. (The lecture was sponsored by Bruker.) Before the lecture, I fully confess to being unfamiliar with her work; but I am actively familiarizing myself with it now.
I have seen, probably, hundreds, if not thousands of lectures on mass spec, and I'm sure I'll always place this one near the top, comparable to a lecture some years ago in the same forum by Dr. Richard Caprioli during which, among neat tricks, he showed imagines based on the proteome of a whole mouse, and discussed the proteome of a person who died around the time of the American Civil war.
In Dr. Ge's lecture, she discussed the creation of human heart muscle tissue, generated by culturing human stem cells derived from human blood, and culturing them so as to produce human heart muscle, which was then implanted into pigs (which have a proteome in many ways the closest to human) which had induced cardiac infartions, heart attacks.
The lecture included a short video of the generated tissue beating like a human heart.
The guts of Dr. Ge's paper, again available on line, but the abstract covers what the whole thing is about.
Background:
Here, we generated human cardiac muscle patches (hCMPs) of clinically relevant dimensions (4 cm × 2 cm × 1.25 mm) by suspending cardiomyocytes, smooth muscle cells, and endothelial cells that had been differentiated from human induced-pluripotent stem cells in a fibrin scaffold and then culturing the construct on a dynamic (rocking) platform.
Methods:
In vitro assessments of hCMPs suggest maturation in response to dynamic culture stimulation. In vivo assessments were conducted in a porcine model of myocardial infarction (MI). Animal groups included: MI hearts treated with 2 hCMPs (MI+hCMP, n=13), MI hearts treated with 2 cell-free open fibrin patches (n=14), or MI hearts with neither experimental patch (n=15); a fourth group of animals underwent sham surgery (Sham, n=8). Cardiac function and infarct size were evaluated by MRI, arrhythmia incidence by implanted loop recorders, and the engraftment rate by calculation of quantitative polymerase chain reaction measurements of expression of the human Y chromosome. Additional studies examined the myocardial protein expression profile changes and potential mechanisms of action that related to exosomes from the cell patch.
Results:
The hCMPs began to beat synchronously within 1 day of fabrication, and after 7 days of dynamic culture stimulation, in vitro assessments indicated the mechanisms related to the improvements in electronic mechanical coupling, calcium-handling, and force generation, suggesting a maturation process during the dynamic culture. The engraftment rate was 10.9±1.8% at 4 weeks after the transplantation. The hCMP transplantation was associated with significant improvements in left ventricular function, infarct size, myocardial wall stress, myocardial hypertrophy, and reduced apoptosis in the periscar boarder zone myocardium. hCMP transplantation also reversed some MI-associated changes in sarcomeric regulatory protein phosphorylation. The exosomes released from the hCMP appeared to have cytoprotective properties that improved cardiomyocyte survival.
Conclusions:
We have fabricated a clinically relevant size of hCMP with trilineage cardiac cells derived from human induced-pluripotent stem cells. The hCMP matures in vitro during 7 days of dynamic culture. Transplantation of this type of hCMP results in significantly reduced infarct size and improvements in cardiac function that are associated with reduction in left ventricular wall stress. The hCMP treatment is not associated with significant changes in arrhythmogenicity.
My point here is that Dr. Ge is clearly an immigrant, as are clearly some of her students, a function of China sending us some of her best and brightest to enlighten and raise us up out of the dregs of ignorance.
There are zero members among the 50 members of the White Supremacist Party in the United States Senate, and Zero members of that same party in the Congress who are her intellectual equal.
Zero.
Not the child molester from Florida and his idiot gun toting racist apologist with whom he travels while she rambles about Jewish space lasers, not Kevin the Klansman, the insurrectionist Minority Leader, not Moscow Mitch, none of them.
Let me say that again: Zero.
They are all, 100% of these white people in the US Congress in the White Supremacist Party, and their token African American from South Carolina, who would be qualified to wash glassware in her lab.
Just saying, in anger...
It just occurred to me who the President who did the most to fight Covid was.
That would be Bill Clinton.
By pushing the human genome project and publicly funding it, he helped to improve the speed of genomic sequencing, and build a huge infrastructure around it.
Now we can sequence just about any living thing, from flies, to apes, to hippopotamuses to viruses.
It was public funding of science at its best.
If you get a vaccine, thank Bill.
Plutonium-244 Discovered on the Ocean Floor Constrain the Yields of Recent Local Supernovae.
The paper I'll discuss in this post is this one: 60Fe and 244Pu deposited on Earth constrain the r-process yields of recent nearby supernovae (Wallner et al., Science, 14 May 2021: Vol. 372, Issue 6543, pp. 742-745)
Not so long ago in this space, I referred to the campaign taking many years to produce the world supply, 7 grams, of the very long lived isotope of plutonium, Pu-244: Recovery of Trivalent Lanthanides and Transplutonium Actinides with Resin Supported Diglycomides. This rare isotope has a half-life of 81.1 million years, making it useful as an internal standard in nuclear forensics, as a target for the synthesis of the super-heavy elements, and for the study of chemical properties of the element, while minimizing occlusive effects associated with the higher radioactivity of isotopes with a longer half life. Very little Pu-244 is formed in commercial nuclear reactors, nor were large amounts formed in the era of nuclear testing. Early reports indicated that Am-244 had a branch ratio by which a tiny amount, on the order of 1 decay in 1000, decayed by electron capture to give Pu-244, but when I went to the latest data tables at the Brookhaven National Laboratory's Nuclear Data pages, it is now reported that this isotope actually decays 100% by β- to give Cm-244. This means that the only path to the creation of Pu-244 relies in neutron capture in Pu-243, an isotope with a short half-life, about 5 hours, or by the decay of Cm-248, which can only be produced with very long irradiation times, and in any case, has a long lifetime - its half-life is 348,000 years - precluding it's use as a Pu-244 source. Although I do not know whether the fission cross section or capture cross sections of Pu-243 are known, as a nuclei with an odd mass number and an even atomic number, the fission to capture ratio is likely to be fairly high. Nevertheless, it is possible, as it was in historical high flux research nuclear reactors, to produce rather small amounts of this isotope. (It is also believed that small amounts of Pu-244 may have been formed in historic open air hydrogen bomb tests, which produce high neutron fluxes, but the isotope has not been detected in fall out to my knowledge.)
The situation is quite different in collapsing stars, supernovae, where the neutron flux can easily dwarf anything that can be generated on Earth, as well as during collisions between neutron stars. The collapse of these stars has produced all of the uranium and thorium, the billions of tons of each, that now drives the internal heat of the Earth (with a minor assist from radioactive potassium-40). This takes place during the "r-process" in which nuclei absorb neutrons faster than they can decay by beta emission, thus producing very heavy nuclei up to an including fermium, and perhaps even higher. As a result, much of the thorium-232, the isotope that dominates all of Earth's thorium, may be the decay product of Pu-244 and/or it's precursor, Cm-248.
The long half-life of Pu-244 suggests that may have survived long enough to have accreted in the early Earth, and it believed that an isotope of the xenon present in the Earth's atmosphere may have been formed by spontaneous fission of this historic Pu-244. One can calculate that 1 kg of Pu-244 in the early Earth would leave behind about 48 million atoms after 4.5 billion years.
In 1971, the great nuclear chemist Darleane Hoffman reported that she had discovered a few atoms of Pu-244 in lanthanide ores at the Mountain Pass mine, after reasoning that the geochemistry of plutonium should be very similar to that of cerium and thorium, both of which are constituents of these ores. (Thorium is a by product of the lanthanide ("rare earth" ) mining on which so called "renewable energy" and many other technologies depend. If recovered from mine tailings, this thorium could in theory replace all mining for energy purposes for many hundreds of years.) Her report, which has not been confirmed by the use of accelerator mass spec, is here: Detection of Plutonium-244 in Nature (D. C. Hoffman, F. O. Lawrence, J. L. Mewherter & F. M. Rourke, Nature volume 234, pages132–134 (1971))
The paper cited at the outset refers to Pu-244 that is believed to have rained down on Earth in recent times as a result of supernovae that took place near our solar system in the last tens of millions of years.
The abstract is open sourced. From the introduction to the paper itself:
The Solar System (SS) is located inside a large ISM structure [the Local Superbubble (LB)] that was shaped by supernova (SN) explosions during the last ~12 million years (Myr) (8). Earth has therefore been exposed to both ejecta from the SNe and swept-up interstellar material that traversed the SS during this time period (9, 10). Dust particles from the ISM pass through the SS (11) and contain nucleosynthetic products of stellar events (e.g., stellar winds and SNe) (10, 12, 13). Earth’s initial abundance of the 60Fe radionuclide [half-life (t1/2) = 2.6 Myr (14, 15)] has decayed to extinction over the 4.6 billion years (Gyr) since the SS’s formation. 60Fe, however, is produced in massive stars and ejected in SN explosions. Evidence for the deposition of extraterrestrial 60Fe on Earth has been found in deep-sea geological archives dated to between 1.7 and 3.2 million years ago (Ma) (16–20), at recent times (21, 22), and possibly also around 7 Ma (19). 60Fe has also been detected in lunar samples (23), in astronomical observations of gamma rays associated with its radioactive decay (24), and in galactic cosmic rays (25). SN activity in the last ~2 Myr is suggested by an excess in the local cosmic-ray spectrum (26). Other radionuclides are also produced and ejected in such explosions (9, 27–30). If substantial r-process nuclei are produced in SNe this would also have enriched the local ISM with actinides, such as 244Pu. With a half-life of 80.6 Myr, 244Pu is much longer lived than 60Fe, so it can be contributed by older r-process events, not limited to those that formed the LB. Either as part of the SN direct ejecta or as continuous ISM influx, we expect dust particles containing 244Pu to enter the SS, similarly to 60Fe, but probing different nucleosynthetic processes. Previous measurements in terrestrial or lunar archives have provided only upper limits on actinide influx (12, 31–33).
We searched for extraterrestrial 60Fe and 244Pu incorporated into a deep-sea sample on Earth—a ferromanganese crust (which we refer to as Crust-3) that spans the last 10 Myr, sampled at ~1500 m below sea level in the Pacific Ocean, with 115-cm2 cross-sectional area and ~25-mm thickness (27). The radionuclides were identified and counted using accelerator mass spectrometry (AMS) (27). For 60Fe, a time-resolved depth profile of ~1-cm2 area was analyzed, subdivided into 24 layers, each ~1-mm thick, corresponding to a time resolution of ~0.4 Myr per layer [crust growth-rate of ~2.4 mm Myr−1, dated with terrestrial 10Be (27)]. The remaining part of Crust-3 (114-cm2 area), after separating the aliquots used for 60Fe analysis, was split into three thick, horizontal layers designated 3/A (extending from 0 to 3 mm, equivalent to 0 to 1.3 Ma, with a mass of ~20 g), 3/B (3 to 10 mm, 1.3 to 4.6 Ma, 179 g), and 3/C (10 to 20 mm, 4.6 to 9.0 Ma, 208 g), given the anticipated low abundance of 244Pu. We expected the top layer to contain anthropogenic Pu from atmospheric nuclear weapons tests performed during the 20th century...
Radioactive iron-60 is also formed in nuclear weapons tests, from neutron capture in the steel casings, and it can also be formed in small amounts in commercial nuclear reactors having steel cores - this accounts for Co-60 in pressurized water and boiling water reactors. However, in sediments, the age of the sediments can be determined by examining the Co-60/Fe-60 ratio or the ratio of Ni-60, the final stable decay product. The authors here took other steps to differentiate the age of their sediments to differentiate them from nuclear weapons testing contamination. They used beryllium-10, the radioactive isotope that forms naturally in the Earth's atmosphere by spallation from oxygen and nitrogen interacting with cosmic rays.
They detected 435 atoms of Fe-60 in their samples.
Table 1 from the paper:
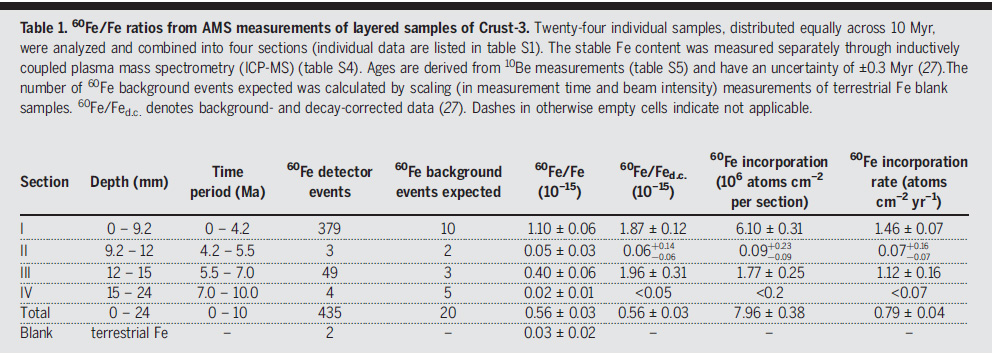
The caption to table 1:
Twenty-four individual samples, distributed equally across 10 Myr, were analyzed and combined into four sections (individual data are listed in table S1). The stable Fe content was measured separately through inductively coupled plasma mass spectrometry (ICP-MS) (table S4). Ages are derived from 10Be measurements (table S5) and have an uncertainty of ±0.3 Myr (27).The number of 60Fe background events expected was calculated by scaling (in measurement time and beam intensity) measurements of terrestrial Fe blank samples. 60Fe/Fed.c. denotes background- and decay-corrected data (27). Dashes in otherwise empty cells indicate not applicable.
They were also able to differentiate Pu-244 of extraterrestrial origin from nuclear testing contamination by determining the ratios of Pu-244 to its decay product Pu-240 and the presence or absence of Pu-239, Pu-241 (and its decay product Am-241), Pu-242:
Pictures from the text:

The caption:
(A) 60Fe incorporation rates for Crust-3. The data (red points) have been decay corrected, and each layer is equivalent to 400 thousand years. The absolute ages have an uncertainty of ~0.3 to 0.5 Myr (27). (B) 244Pu incorporation rates for the three layers after subtraction of the anthropogenic 244Pu fraction (27). (C) 244PuISM/60Fe number ratio in the crust sample with layers 1 and 2 combined (horizontal solid lines with shaded error bars). All error bars show 1σ Poisson statistics.

The caption:
(A and B) Variations of the measured 240Pu/239Pu ratio (A) and the 244Pu/239Pu ratio (B) across the three layers (solid red lines). The dashed red lines and gray shading indicate 1σ uncertainties. The blue shaded area and solid line represent the expected ratios for Pu from nuclear weapons fallout (27). 240Pu/239Pu remains constant across the three layers, whereas 244Pu/239Pu is enhanced in the deeper (older) layers. We attribute the excess above anthropogenic (anthr) levels to extraterrestrial 244Pu. Equivalent data for 241Pu/239Pu are shown in fig.
Table 2 from the paper:
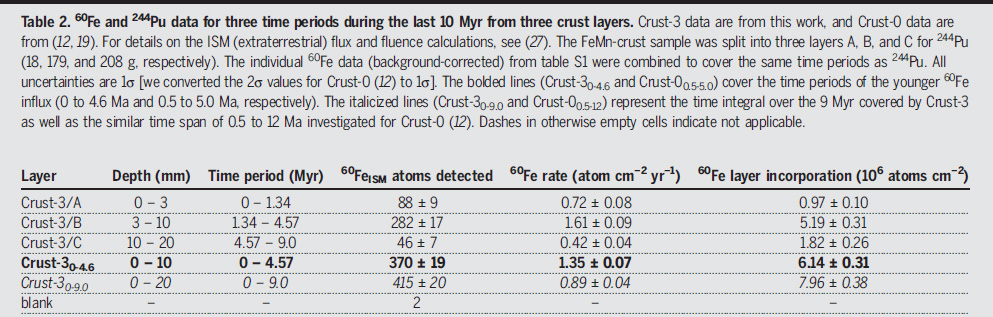
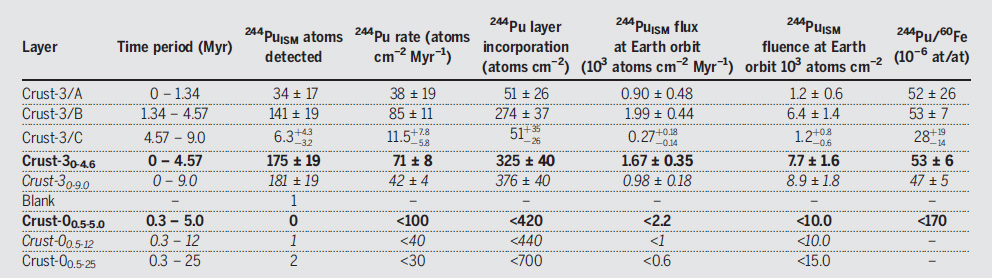
The caption to Table 2:
Crust-3 data are from this work, and Crust-0 data are from (12, 19). For details on the ISM (extraterrestrial) flux and fluence calculations, see (27). The FeMn-crust sample was split into three layers A, B, and C for 244Pu (18, 179, and 208 g, respectively). The individual 60Fe data (background-corrected) from table S1 were combined to cover the same time periods as 244Pu. All uncertainties are 1σ [we converted the 2σ values for Crust-0 (12) to 1σ]. The bolded lines (Crust-30-4.6 and Crust-00.5-5.0) cover the time periods of the younger 60Fe influx (0 to 4.6 Ma and 0.5 to 5.0 Ma, respectively). The italicized lines (Crust-30-9.0 and Crust-00.5-12) represent the time integral over the 9 Myr covered by Crust-3 as well as the similar time span of 0.5 to 12 Ma investigated for Crust-0 (12). Dashes in otherwise empty cells indicate not applicable.
From the conclusion to the paper:
Esoteric, but cool, I think.
Have a great and safe weekend.
Reduced neutralization of SARS-CoV-2 B.1.1.7 variant by convalescent and vaccine sera
Before citing this paper, let me start with the "Do not panic button, by excerpting the study's limitations from the end of the paper.
To wit:
The correlates of protection from SARS-CoV-2 infection are yet to be established. The in vitro neutralization assays reported here do not convey the contributions to in vivo protection provided by T cells nor the contributions of Fcγ receptor interactions and complement activation. Convalescent plasma and vaccine serum were taken relatively soon after acute illness or following vaccination; it is possible that titers will drop over time to a point where they are no longer high enough to provide protection. It will be interesting to understand the antibody response made by people infected by B.1.1.7, particularly how antibodies adapt to the N501Y change, but also the deletions occurring in the NTD. It will also be instructive to look at how well convalescent or vaccine serum can neutralize the other recently described variants B.1.351 and P.1 and, conversely, how well serum from patients infected with these variants can neutralize B.1.1.7 and the original Wuhan strains.
I have added the bold.
The paper under discussion is this one: Reduced neutralization of SARS-CoV-2 B.1.1.7 variant by convalescent and vaccine sera (Mongkolsapaya, Stuart, Screaton et al., Cell VOLUME 184, ISSUE 8, P2201-2211.E7, APRIL 15, 2021)
This article is open sourced, and anyone can read it, so I'll just excerpt a few things, and show, for convenience, a few graphics.
From the introduction:
Huge strides have been made in the understanding of SARS-CoV-2 over the last year, which are exemplified by the licensing of several vaccines (in the UK those made by Pfizer-BioNtech, Moderna, and Oxford-AstraZeneca), which are being rolled out in massive global vaccination programs, with the aim to reach billions of individuals in 2021. Furthermore, Janssen and Novavax have recently reported results showing good efficacy and also report efficacy against the UK B.1.1.7 strain (https://blogs.sciencemag.org/pipeline/archives/2021/01/29/jj-and-novavax-data). In parallel, a number of potently neutralizing monoclonal antibodies (mAbs) have been developed that are in late-stage trials to be used prophylactically or therapeutically (Baum et al., 2020, Yang et al., 2020).
SARS-CoV-2 is a large positive-stranded RNA virus; the major virion surface glycoprotein is the trimeric spike that attaches the virus to host cells via the ACE2 receptor and, through a series of conformational changes, allows fusion of host and virion membranes releasing the virus RNA into the cell to start the infection cycle (Hoffmann et al., 2020; Ou et al., 2020). Spike is the target of RNA (Polack et al., 2020; Baden et al., 2021), viral vectored (Voysey et al., 2021), and inactivated virus and recombinant protein-based vaccines (Yadav et al., 2020).
Because of the huge number of genome replications that occur in infected populations and error-prone replication, viral mutations do and will continue to occur (Robson et al., 2020). Although the vast majority will be inconsequential or detrimental to viral fitness, a few may give the virus a competitive advantage and be the subject of rapid natural selection relating to transmission advantage, including enhanced replication and immune evasion. This leads to the emergence of dominant new variant viruses. Coronaviruses, as we are seeing with COVID-19, have the potential to alter their proteins with dramatic effect (Denison et al., 2011).
In recent months, a number of mutations in the spike protein have been exemplified by viruses that have grown in alternative hosts such as mink and transmitted back to humans or in immunocompromised chronically infected individuals (Kemp et al., 2020; Oude Munnink et al., 2021; Hayashi et al., 2020). While most of these mutations currently show little evidence of a selective advantage in humans, variants have been identified with multiple mutations in spike, which appear to have distinct selective advantages and have rapidly expanded in prevalence, notably that first identified in Kent in the UK (lineage B.1.1.7) and unrelated variants detected in South Africa (501Y.V2 also known as B.1.351) and Manaus in Brazil (P.1). All of these contain mutations in the ACE2 receptor binding footprint of the receptor binding domain (RBD), one in B.1.1.7, three in 501Y.V2, and three in P.1, with the N501Y mutation being common to all.
"N501Y" refers to the 501st amino acid residue in the spike protein. The "N" refers to the asparagine that was in that position in the original virus first sequenced in Wuhan patients which has been replaced by a tyrosine ("Y"
 in the mutant "B.1" series. I have read elsewhere that it has been recently discovered that this mutant is slightly more lethal than the original, and also that it is more infectious.
The tests described herein are in vitro, sometimes called, someone niavely as being "test tube." There is very little evidence that this variant has reduced the protective effects of the existent vaccines by a large amount, and the vaccines are still helping us in a very big way.
Still, the need to not panic does not preclude an understanding, as mentioned in the introductory text, that this virus can, and does mutate, and given the situation. Therefore it is a good idea to hold on to supplies you may have, such as masks and sanitizers.
Some pictures from the text:

In the caption, "RBD" refers to the "receptor binding domain," the part of the spike protein that attaches to the ACE2 protein on the surface of cells.
The caption:
Figure 1The B.1.1.7 variant spike protein and effect on ACE binding of the N501Y mutation
(B) The RBD “torso” analogy. The RBD is represented as a gray surface with the ACE2 receptor binding site in dark green. Binding sites for the panel of antibodies (Dejnirattisai et al., 2021) on which this study draws are represented by spheres. The spheres represent the point at which placing spherical antibodies would optimally predict the BLI competition data and are colored according to their neutralization, from red (potent) to blue (non-neutralizing). The position of the B.1.1.7 N501Y mutation in the RBD is highlighted in light green toward the right shoulder.
(C) Proximity of ACE2 to N501Y. The RBD is depicted as in (B) with ACE2 bound (in yellow cartoon format) with glycosylation drawn as sticks.
(D) Left panel: interactions of N501 of WT RBD with residues Y41 and K353. The structure shown is the complex of N501 RBD with ACE2 determined by X-ray crystallography (PDB ID 6M0J, Lan et al., 2020). When the 501 is mutated to a tyrosine with the conformation seen in the N501Y RBD-269 Fab complex (right panel), Y501 makes T-shaped ring stacking interactions with Y41 and more hydrophobic contacts with K353 of ACE2 (note there are minor clashes of the side chain of Y501 to the end of the K353 side chain, which has ample room to adjust to optimize interactions).
(E) BLI plots for WT (left) and N501Y (right) RBDs binding to ACE2. A titration series is shown for each (see STAR Methods). Note the much slower off rate for the mutant.
Some text:
The RBD may be likened to a classic human torso; in this analogy, the shoulders and neck are involved in interactions with the ACE2 receptor (Figures 1B and 1C) (Dejnirattisai et al., 2021). In this context, residue 501 lies within the footprint of the receptor on the right shoulder and is involved in hydrophobic interactions, especially with the side chains of residues Y41 and K353 of ACE2 with the 501 mutation from N to Y offering the opportunity for enhanced interactions (Figures 1C and 1D).
Effect on ACE2 affinity
It has been reported that mutations at 501 can increase affinity for ACE2 (Starr et al., 2020; Gu et al., 2020), although these data are not for the mutation to Y. In contrast, Zahradník et al., 2021 report direct selection of N501Y when evolving the RBD to enhance affinity. We therefore investigated the effect of this mutation on ACE2 binding by RBD using biolayer interferometry (BLI) (Figure 1E). The results indicate a marked (7-fold) increase in binding affinity due to a slower off rate: WT RBD(501N)-ACE2: KD 75.1 nM (Kon 3.88E4 /Ms, Koff 2.92E-3 /s), RBD(501Y)-ACE2: KD 10.7 nM (Kon 6.38E4 /Ms, Koff 6.85E-4/s). This is in-line with enhanced interactions of the tyrosine side chain with the side chains of residues Y41 and K353 of ACE2 (Figure 1D). In the context of a multivalent interaction at the cell surface, this effect would be amplified. This alone might account for the selection of the N501Y mutation and an increase in transmission.
The authors utilized a set of 377 antibodies isolated from patients either who had been infected in the first wave. 80 of these have been fully mapped to elucidate the binding sites of the antibodies. In many cases, they found reduced binding.
However, as noted in the first excerpt from the last part of the paper's main text, the reduced binding does not preclude vaccine protection. Notably, the infection can be managed by T-cells as opposed to B-cell antibodies.
The full paper is available for reading for free. It may take some sophistication to understand all that is being said in there, but I think it readable and it's worth mucking around in it. If there are any questions that I may be able to answer, let me know and I'll do my best.
For now, we seem safe, if we've been vaccinated. If we're dumb assed anti-vax Republicans, the Darwin award awaits; this strain is definitely more lethal, although still susceptible to being managed by the vaccines.
Still the situation in India, affording many opportunities to generate new strains suggests that new vaccines may be required at some point. Some that have modified to reflect the new strains have already been prepared and are being tested in patients. We have considerable infrastructure for the manufacture of these, and considerable knowledge capital as well, so we're in relatively good shape. It is important that we do our best to provide other nations with access to these vaccines, since all of humanity shares this risk.
Be safe. Be well.
I learned a new German word today that's relatively new even to Germans, "Dunkelflaute"
I learned it here: Variability in Deeply Decarbonized Electricity Systems (John Bistline, Environmental Science & Technology 2021 55 (9), 5629-5635)
The context:
While my German is very, very, very, very rusty - it's been years since I did anything significant with that language - I have a feeling that Dunkelflaute worries some people, pisses others off:
Die Zeiten, in denen solche Knappheiten am Markt neue Investitionsanreize auslösten, sind vorbei. „Stattdessen sind wir schon heute auf eine Reihe von Reparaturmaßnahmen angewiesen: Netzreserve, Kapazitätsreserve oder netztechnische Betriebsmittel kaschieren mehr schlecht als recht die Defizite der deutschen Energiepolitik und Marktkonditionen“, schimpft Kapferer: „Auf Dauer wird das nicht funktionieren.“
In der „kalten Dunkelflaute“ rächt sich die Energiewende
With my bad German, I translate this as: The Energy Transition Is Taking Revenge in Cold, Dark, Doldrums.
I could be wrong though, maybe it doesn't translate that way. Maybe it translates as "Don't worry; be happy."
Here's another reference to Dunkelflaute, in English from another journal, Mesoscale modeling of a “Dunkelflaute” event (Basu et al., Wind Energy, Volume24, Issue1 January 2021 Pages 5-23)
An excerpt from this open source journal:
In this paper, we focus on one such weather phenomenon called “Dunkelflaute” as it is rapidly becoming a major concern for the renewable energy community.6 The word Dunkelflaute was coined by combining two German words “Dunkelheit” (darkness) and “Windflaute” (little wind) to describe heavy overcast skies and weak wind conditions. These meteorological events can last from a few hours to a few consecutive days. It is needless to say that under the influence of such a meteorological condition, little or no wind and solar energy can be produced.
On the 30th April 2018, an unexpected Dunkelflaute event occurred over the southern part of the North Sea and caused a large imbalance in renewable power generation and overall consumption. Given the acuteness of the situation, TenneT—the main transmission system operator for Germany and the Netherlands—had to issue an emergency alert in the Netherlands.7, 8 The crisis could not be avoided by simple load management or by making use of reserve power; instead, a substantial amount of electricity had to be imported from neighboring countries at high market price.
This Dunkelflaute event was not an isolated episode. As a matter of fact, over the past few years, several Dunkelflaute events occurred in Belgium,9-12 Germany,6, 13-15 and other neighboring countries. Some of them caused significant impacts on the power grids and electricity markets. There is no reason to believe that the occurrences of Dunkelflaute will subside in the future. Instead, with the ever increasing penetration of renewables in the power grid, the (negative) impacts of Dunkelflaute events will likely become more and more detrimental.
Germany by the way, is famous for phasing out nuclear energy, which will be complete by the end of next year. They have announced the intention to phase out coal "by 2038." At the current rate, of 2.4 ppm per year of carbon dioxide accumulations , as determined from the weekly Mauna Loa CO2 data from last week using a 12 month running average of weekly data, "by 2038," the carbon dioxide concentrations on this planet will be 444 ppm, up from 420.01 ppm recorded in the week beginning April 25, 2021.
In 2011, when the Energiewende plan was first published, including a nuclear phase out, the rate of increase in the dangerous fossil fuel waste carbon dioxide in the planetary atmosphere, again as a 12 month running average of weekly data, was 2.03 ppm/year, as recorded on May 8, 2011.
(The figures rely on the average difference between the weekly reading and the reading of the same week 10 years earlier.)
In the year 2000, for the week beginning May 7, 2000, the figure was 1.50 ppm/year. The concentration of the dangerous fossil fuel waste carbon dioxide in the planetary atmosphere as measured at Mauna Loa for the week beginning May 7, 2000 was 371.70 ppm.
Don't worry, be happy.
Air pollution from coal kills people by the way. Air pollution deaths worldwide easily outstrip, on a daily basis, Covid-19 deaths.
So called "nuclear waste," hasn't killed anybody in recent times, but lots of people pull their hair out claiming it could, some day, somewhere. In modern times could is a much scarier word than is, as in "nuclear waste could kill someone someday" as opposed to "coal air pollution is killing people every day.
Am I crazy for thinking Germany, once the country of Planck, Sommerfeld, Hilbert, Born, Heisenberg and others of similar powers, has things ass backwards?
I guess I am.
Dunkelflaute. Dark doldrums.
For a last comment, I'll excerpt a few remarks from another paper using the word "Dunkelflaute" from the Oxford Institute for Energy Studies, leaving aside what should be, but perhaps isn't, obvious, that no country that burns dangerous natural gas is "decarbonized."
The role of natural gas, renewables and energy efficiency in decarbonisation in Germany: The need to complement renewables by decarbonized gas to meet the Paris target
The reason that so called "renewable energy," was phased out in the 19th and early 20th century was that most people, even more so than today, lived short, miserable lives of dire poverty.
Even today, poverty is best defined by a lack of access to energy.
It is possible to provide reliable and clean and safe energy for those who have it as well as those who still lack it except for scraps of "renewable biomass." This is only true, however, if we stop lying to ourselves. Our water is already dependent on the weather, and is in fact, severely threatened by climate change. Is it really a good idea to make the electricity for the computers we run to say how great so called "renewable energy" is dependent on the weather as well? The electricity to run oxygen generators? Surgical lamps? Our much loved television sets? Refrigerators? Freezers.
Dunkelflaute.
The wikipedia entry for the word:
The first use of the term in an academic paper is in 2014.[6]
Dunkelflaute, some ideology is Dunkelflaute.
Profile Information
Gender: MaleCurrent location: New Jersey
Member since: 2002
Number of posts: 33,512