NNadir
NNadir's JournalKurt Vonnegut on the Shapes of Stories.
My favorite, by far, fiction writer of all time, if only for the best opening line of a book that is not an opening line:
"Listen."
Strategies to Reduce the Environmental Lifetimes of Drinking Straws in the Coastal Ocean
The paper to which I'll briefly refer is this one: Strategies to Reduce the Environmental Lifetimes of Drinking Straws in the Coastal Ocean. Bryan D. James, Yanchen Sun, Mounir Izallalen, Sharmistha Mazumder, Steven T. Perri, Brian Edwards, Jos de Wit, Christopher M. Reddy, and Collin P. Ward ACS Sustainable Chemistry & Engineering 2024 12 (6), 2404-2411.
I try to think about every piece of plastic I handle these days, considering that each may last centuries after my death. I avoid plastics where possible, but frankly it often isn't possible. In the case of straws, and for that matter cup covers, I avoid using them at all. You can drink liquids without a straw. I also have reusable coffee cups, two given to me as promotional trinkets by an instrument company trying to sell me instruments.
Anyway, straws are a problem:
From the introductory text:
In this initial study, we aimed to constrain the environmental lifetimes of commercial drinking straws in the coastal ocean, determine the microbial communities assembling on and presumably degrading these items, and assess engineered strategies to minimize persistence. We exposed commercial drinking straws made of cellulose diacetate (CDA), polyhydroxyalkanoates (PHAs), coated and uncoated paper, industrially compostable polylactic acid (PLA), and PP to marine microbes in a flow-through seawater mesocosm for 16 weeks. Throughout the experiment, we measured the mass loss of the straws and collected biofilms from the straws at the end of 16 weeks for microbial community analyses...
The authors passed seawater through straws of various composition, as described in the intro, photographed them and weighed them and studied the organisms growing on them.
Some graphical results:
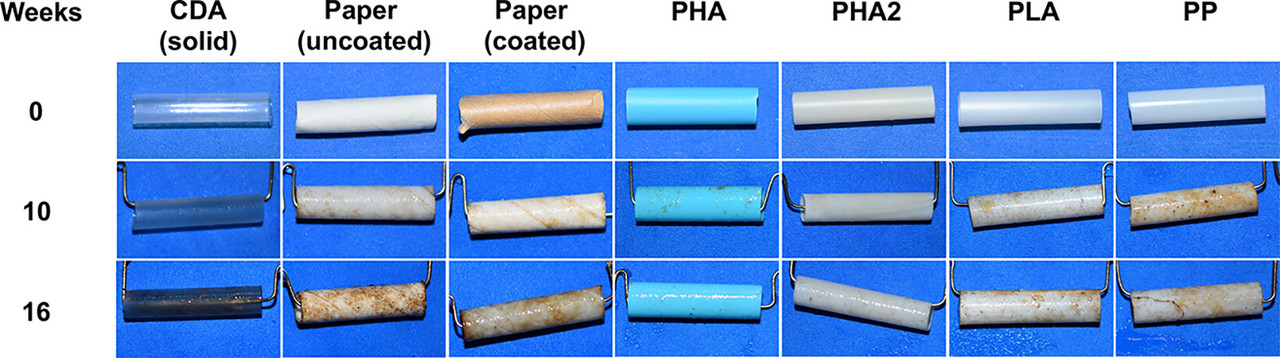
The caption:
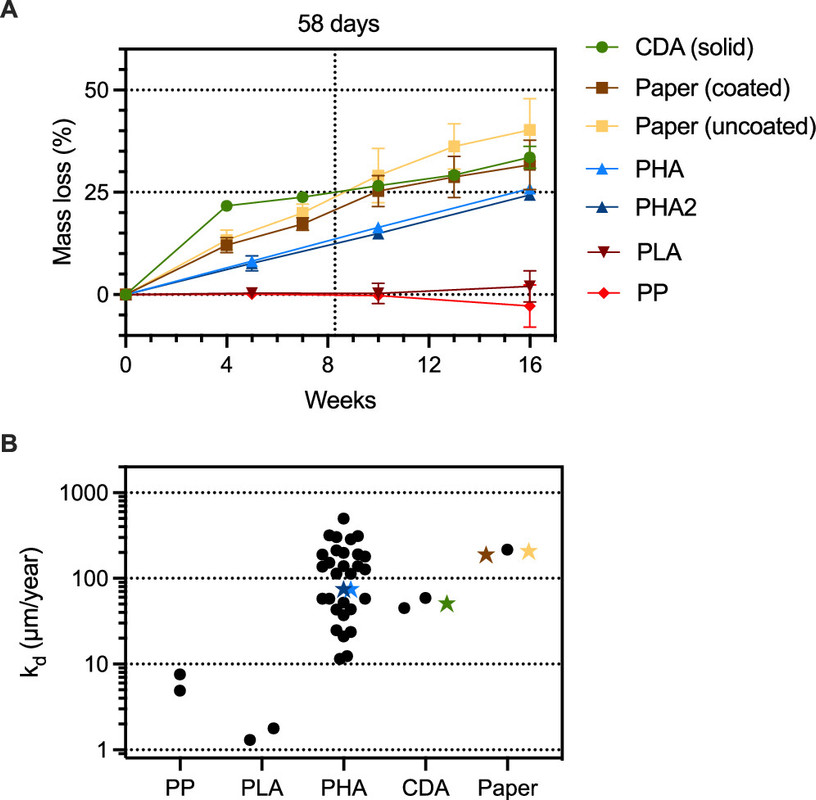
The caption:
From the conclusion:
Small things are big problems, and for the big problems we need people working on seemingly small things that turn out to not be all that small.
Have a nice evening.
Supernova mystery solved: JWST reveals the fate of an iconic stellar explosion
From my Nature News feed:
Supernova mystery solved: JWST reveals the fate of an iconic stellar explosion
Subtitle:
Some excerpts:
Astronomers used the observatory to finally spot signs of an ultradense ‘neutron star’ lurking in the explosion’s core in a galaxy that orbits the Milky Way. Light from the explosion reached Earth 37 years ago this week, in a supernova that revolutionized modern astrophysics by providing an up-close look at how stars die.
But despite years of studying this blast, known as supernova (SN) 1987A, astronomers had not been able to detect what was left behind: maybe a black hole, which can sometimes be formed, or perhaps a neutron star, as many predicted?
“It’s something that’s been searched for ever since the explosion,” says Patrick Kavanagh, an astrophysicist at Maynooth University in Ireland, and a member of the team reporting the discovery today in Science1. “And now we’ve found it.”
JWST did not observe the neutron star directly, because it remains obscured behind a veil of dust from the explosion. But the telescope detected light coming from argon and sulfur atoms that had been ionized, or electrically charged, by radiation blazing from the long-sought neutron star...
... One outcome of such a supernova is to leave behind a black hole. But early observations of SN 1987A, such as the wave of neutrinos, suggested that it should have given rise to a neutron star, which can be just 20 kilometres across but is so dense that a teaspoonful weighs millions of tonnes. Astronomers have found several tantalizing hints of this outcome using other telescopes, but none have yielded a solid conclusion, meaning that other possibilities were still on the table2,3.
Enter JWST, which launched in late 2021 and can observe celestial bodies at different wavelengths and higher resolution than can many other telescopes. In July 2022, in some of its first scientific observations, the powerful space telescope observed SN 1987A for nine hours. Two of its cutting-edge instruments provided unprecedented insights into what was happening at the heart of the exploded star...
How to find meaning in your science career: six expert tips
I think most of us here at DU are, um, "older folks," but I do hope we have some young 'uns around, and I monitor these "career" pages to advise young people I might run into. I liked this article in Nature:
How to find meaning in your science career: six expert tips|How to find meaning in your science career: six expert tips
Subtitle:
It may be open sourced; I'm not on my Nature account although I received it from my Nature News Briefing email feed:
Some excerpts:
One conventional framework for thinking about meaningful work is to look for the intersection between what you are good at, what you love, what you can be paid for and what the world needs. Unfortunately, few careers land neatly in the middle of this Venn diagram, says Michaelson, with laboratory work probably falling into the category of worthwhile but underpaid.
Rather than wrestling with whether we should serve ourselves by doing what we love, or instead serve the needs of others, Michaelson says a pragmatic answer is to think about how to turn what you love into something that is beneficial to the world, or vice versa. For a researcher, this might involve directing a passion for artificial intelligence into regulation of the technology, or tilting research on car emissions towards work on low-emission cars. Or it might mean choosing work that is worthwhile — and becoming good enough at it that satisfaction will follow...
...2. Choose a pressing problem
In 2011, University of Oxford philosophy students Will MacAskill and Ben Todd were trying to work out how to pursue worthwhile careers. They found that standard career advice fell short because it didn’t show which path might help the world most. That prompted them to start 80,000 Hours, a careers advisory organization in London, that aims to help students have the biggest positive impact with the 80,000 working hours in their lives (40 hours × 50 weeks × 40 years). It became a foundational group in the worldwide ‘effective altruism’ movement, which seeks the most impactful ways to help others.,,
...3. Be prepared to work behind the scenes
Having an impact when it comes to research often means shaping governmental or other policies. But early-career researchers often don’t know where to start, says Paul Cairney, who studies evidence and public policy at the University of Stirling, UK. Some “don’t even know what impact means, or what is expected of them”, he says...
Others include "do your homework and follow the data" which I have bolded because when I think of discussions of energy, not my profession but rather my passion, I am startled to see how much focuses on wishful thinking as if it eclipses data. For my own bête noire, there is the matter of praising so called "renewable energy" as being involved with climate change when the CO2 concentration data is showing it's making things worse, not better.
Another is "keep sight of the big picture"
And #6 is the one with which I, and other advocates of nuclear energy, surely recognize, "changing the world is hard."
I was very proud to see on my son's Linkedin pages one of his undergraduate associates write of my son that he wanted to change the world.
Good advice, I think.
My own career is not the one I would have chosen based on who I am now, but my professional career has been rewarding, even if I did not really have much control over its direction. Certainly what I do has benefited the world, but well, I should have been more...
More Evidence That the NYTimes Is Supporting Trump.
Note this headline and the editorial word in what is supposed to be a news "report."
Biden Tries to Turn the Tables on Trump: ‘He’s About as Old as I Am.’
Biden Tries to Turn the Tables on Trump: ‘He’s About as Old as I Am’
The implication, in the New York Times which carries on in defiance of reality about how handsome, tall and vital Trump is, is that President Biden has failed, in stating a fact, to correct the media's denial of that fact.
Facts matter.
Trump is not only a fraud, a criminal, a vicious racist, an intellectual Lilliputian, and Russian asset, but he is increasingly and obviously displaying the elements of a disease that is known to have a genetic component and killed his father, Alzheimer's.
It's not that I wish Alzheimer's on anyone, but I certainly don't wish it on an entire country, despite the fact that the "paper of record" apparently does.
Electrochemical Production of Acetylene from CO2 Using Molten Chloride Salts.
The following paper is open to the public, and there is no need to excerpt it extensively: New Route of Acetylene Synthesis via Electrochemical Formation of Metal Carbides from CO2 in Chloride Melts Yuta Suzuki, Seiya Tanaka, Takashi Watanabe, Tomohiro Isogai, Akiyoshi Yamauchi, Yosuke Kishikawa, and Takuya Goto ACS Sustainable Chemistry & Engineering 2024 12 (5), 2110-2119.
It is well known that one route to acetylene is to react molten calcium metal with carbon and then hydrolyze it with water, generating calcium hydroxide and acetylene.
Acetylene is, of course, a fuel, generally used in welding torches and other high temperature applications, but it can also be a key intermediate in the production of ethylene (ethene) a very valuable chemical commodity.
What is cool about this paper is the production, electrochemically, of calcium (or lithium) carbide from CO2 in chloride melts.
By coincidence I just attended a lecture by the great chemist Jim Wishart of BNL on the subject of chloride melts, whereupon he commented on their structure, although I haven't necessarily been a chloride melt kind of guy, at least not for nuclear applications.
I commented on similar work designed to produce elemental carbon from CO2 elsewhere on DU:
Electrolysis of Lithium-Free Molten Carbonates
In a case where waste electricity is available as a result of process intensification using nuclear heat, these kinds of processes can be utilized, in theory, to reverse climate change. Note however that to reduce CO2, all of the energy generated that put it there, plus an investment of energy to overcome entropy, must be reproduced.
Nonetheless, this is a very cool paper, with nice references pointing to papers on the formation of valuable transition metal carbides.
Enjoy the work week.
Flax Processing for Those Who Like to Grow and Make Their Own Linen.
Just in case you lie awake at night thinking how to do this:
Grow your own linen.
I don't know how I get to these things, but I do: Flax processing.
A U.S. Lead Exposure Hotspots Analysis
The paper to which I'll refer in this post is this one: A U.S. Lead Exposure Hotspots Analysis Valerie G. Zartarian, Jianping Xue, Antonios G. Poulakos, Rogelio Tornero-Velez, Lindsay W. Stanek, Emily Snyder, Veronica Helms Garrison, Kathryn Egan, and Joseph G. Courtney Environmental Science & Technology 2024 58 (7), 3311-3321
The paper is open to the public, anyone can read it. I'll produce a few important excerpts on the "methods" which involves measurement of lead levels in children's blood but first produce here the telling graphic:

From the introduction:
Identifying and addressing remaining lead exposure risk hotspots are priorities in the United States. The Federal Lead Action Plan (10) and the U.S. Environmental Protection Agency (EPA) Lead Strategy (e.g., Goal 2, “Identify Communities with High Lead Exposures and Improve Their Health Outcomes”) (9) highlight the need for lead mapping as part of whole-of-government efforts to address high exposure risk locations and disparities. Data mapping can inform screening and prioritization efforts to guide interventions and “deeper dive” analyses (such as enhancing children’s blood lead level (BLL) surveillance data analyses and lead source apportionment analyses). These analyses can assist in efforts around primary prevention; lead-based paint mitigation; lead remediation, enforcement, education, and outreach. (11) Federal agencies are collaborating to identify geographic locations and populations at risk for lead exposure so that they can be addressed proactively. Examples include targeting HUD remediation grants, EPA environmental cleanup actions, and CDC primary prevention and enhanced blood lead testing programs for children. (5)
The methods:
1. Statistically evaluated hotspots identified with lead indices against children’s BLL surveillance data:
(a) from Michigan (MI) and Ohio (OH), using the BLL data and statistical methods described in Xue et al. (12) and Stanek et al., (13) respectively, and an expanded set of national lead indices;
(b) from matching hotspots identified using lead indices with community hotspots identified in 9 state health department public reports (listed in Zartarian et al. (5)) and quantifying the percent; a match is defined here as a community with at least one census tract identified by the lead indices in our analyses;
2. Compared existing national indices against each other and against available BLL surveillance data using sensitivity, specificity, and Cohen’s kappa score to determine which indices are the statistically strongest predictors of hotspots for the national-scale analysis;
3. Produced census tract-level maps for the United States that visualize the intersection and collective combination of hotspots based on the two methods discussed in Xue et al., (12) top 20 (i.e., 80th–100th) percentiles and Getis-Ord Gi* (14) geospatial cluster hotspots analysis methods;
4. Conducted national-scale analyses to identify states and counties with the highest potential lead exposure risk, based on the considered indices and the number of children younger than six years old in the identified 2010 census tracts (n = 73,086 census tracts containing at least one child less than 6 years old in the 50 states)...
I added the bold. "BLL" refers to "blood lead levels"
I had a rather long riff on lead exposure here:
For my 30,000th post, I'd like to thank DU for inspiring me to expand my knowledge, and of course...
Have a pleasant Sunday.
At the Mauna Loa CO2 Observatory, Yet Another Terrifying, Startling Week in 2024.
Two weeks ago I interrupted my standard language for my "monitoring the collapse of the atmosphere through the Mauna Loa CO2 observatory" posts, to remark on being incredibly shocked by the numbers in 2024.
That post is here: At the Mauna Loa CO2 Observatory, a Terrifying, Startling Week and Month, New Records Everywhere.
I also had a thread with a correction to statements I made in that post: An Illuminating Error in My Recent Terrifying Mauna Loa Post.
The point of the second post, the "Illumination" is that 2024 is shaping up to be worse than the worst year ever at the Observatory ever, 2016. Regrettably that trend continues. The 2nd worst week ever in year to year comparators of weeks of the year with that of its previous year has just been observed, just two weeks after the worst was observed.
The week beginning February 18, 2024 is 5.43 ppm higher than the week beginning February 19, 2023.
Before I discuss the terrifying details of yet another astounding number in 2024, here's the standard language I use in these posts:
Facts matter.
When writing these depressing repeating posts about new records being set, reminiscent, over the years, to the ticking of a clock at a deathwatch, I often repeat some of the language from a previous post on this awful series, as I am doing here with some modifications. It saves time.
A recent post of this nature is here: At the Mauna Loa CO2 Observatory, 2024 Starts With a Fairly Disgusting Bang.
As I've been reporting over the years in various contexts, the concentrations of the dangerous fossil fuel waste carbon dioxide which is killing the planet fluctuate sinusoidally over the year, with the rough sine wave superimposed on a roughly quadratic axis:

Monthly Average Mauna Loa CO2
The Observatory posts on its data pages curated and reviewed averages for daily, weekly, monthly, and annual data. I maintain spreadsheets for the latter three to use in calculations.
The data for the week just ended, the week beginning February 18, 2024:
Week beginning on February 18, 2024: 425.11 ppm
Weekly value from 1 year ago: 419.68 ppm
Weekly value from 10 years ago: 398.53 ppm
Last updated: February 24, 2024
Weekly average CO2 at Mauna Loa
First and foremost. 425.11 ppm is the 2nd highest value ever reported at Mauna Loa for the concentration of the dangerous fossil fuel waste carbon dioxide in the planetary atmosphere, slightly less than the value recorded two weeks ago 525.83 ppm. (There is some local "noise" in these readings.)
There have been 2507 points of this type recorded going back to 1975.
This week's increase, from week 5 of 2023 to week 7 is an astounding 5.43 ppm, the 2nd greatest such week to week comparison between consecutive years ever record, by far, the (now) 3rd worst ever having occurred in week beginning July 31, 2016, when the increase was 5.01 ppm, making it one of only three to exceed a 5.00 ppm increase, two from this year, 2024, and one from 2016. 2024 is shaping up to blow 2016 out of the water as "worst ever."
The global average going back to 1975 for all 2507 weeks reported is 1.87 ppm increases in year to year weekly comparators. In the 21st century, that average is 2.20 ppm increases for all weeks in the 21st century.
There have been only seven readings for any of the 2507 weeks in the database that exceeded 424 ppm, all since January 1st, 2023, five in 2023, and two in 2024, a year which is still young. The only readings to exceed 425 ppm have come in 2024. The annual peak will take place in April or May, at the latest in early June. It is sure to be an astounding and terrifying number.
Of the top 50 highest readings out of the 2507, 12 have taken place in the last 5 years, 33 in the last 10 years, and 40 this century.
Of the ten highest comparative year to year readings that took place in the 20th century; six are found in positions 40 to 50.
Three of the first seven weeks of 2024 compared to 2023 appear in the top 50 ever observed.
The week to week comparators from ten years ago (comparators to the same week, week 7, of 2024 to that of 2014) shows an increase of 26.58 ppm, the second highest such increase ever observed after that of two weeks ago, 27.65 ppm higher than week 5 of 2014. A 52 week running average of 10 year comparators, which sort of smooths out the "noise" has reached 24.62 ppm/10 years, the highest value ever. In the seventh week of 2001, that running average was 15.25 ppm/10 years.
I am now maintaining a spreadsheet of the daily readings at the Mauna Loa CO2. Of the top 10 readings ever going back to 1975, seven have taken place in the month of February 2024, one in January of 2024, and two in 2023. The two highest were over 426 ppm.
In spite of these ever worsening and ever more astounding numbers - people lie to each other and to themselves but numbers don't lie - you will still find people mindlessly cheering for bourgeois toys that do nothing, be they electric cars, solar cells and/or wind turbines, to address climate change, all of which are exercises in promoting the use of fossil fuels, the destruction of wilderness, and the demand for mining.
The big lie people tell themselves and each other that this pixilated reactionary scheme, electric cars, solar cells, wind turbines, blah, blah, blah is "doing something" about climate change. This is nonsense. That it is nonsense is clearly shown, again, by the numbers. The reactionary scheme of carrying on about so called "renewable energy" that led us here was never about climate change or any other environmental issue and the claim that it is is an afterthought. It was always about attacking the only realistic alternative to fossil fuels, nuclear energy.
The antinukes won and humanity, and in general the rest of the biosphere lost.
We're clueless.
Enjoy the weekend.
Quantifying the Photolytic Fate of Fluorinated Pharmaceuticals and Pesticides.
The paper I'll discuss in this post is this one: Fluorinated Pharmaceutical and Pesticide Photolysis: Investigating Reactivity and Identifying Fluorinated Products by Combining Computational Chemistry, 19F NMR, and Mass Spectrometry Akash P. Bhat, William C. K. Pomerantz, and William A. Arnold Environmental Science & Technology 2024 58 (7), 3437-3448
The extreme stability of the carbon fluorine bond has made it persistent in the environment, and has resulted in the serious pollution of all terrestrial matrices on this planet, including but not limited to biological matrices. Garnering most attention are the compounds related to consumer and industrial products such as Teflon, certain upholstery protection products, lubricants, coatings, and fire fighting foaming agents, collectively know as "PFAS." One of the concerns connected with the toxicology of the compounds concerns the fact that fluorine in organic molecules has properties that mimic hydroxyl functions, -OH groups, that are very common in all of the major biologically active classes of molecules, notably sugars, including those involved with DNA and RNA, proteins, in particular those rich in the residues serine, threonine and tyrosine, and even certain important lipids signaling, sphingosines, for one example. Fluorine, like oxygen, can form hydrogen bonds, and thus can interfere with biological processes. In addition, trifluoromethyl and difluoromethyl groups are electron withdrawing, and thus can play a role in mimicking the ubitiquous carboxylic acids in living systems. Combined with their stability, which can vastly increase their resistance to metabolism, fluorocarbon moieties are often used by agrochemists and medicinal chemists to lengthen the lifetime and activity of pesticides and medications. Because these compounds are either deliberately sprayed into the environment in the case of pesticides, or excreted in urine in the case of medications, either intact or partially metabolized, and thus find their way into rivers, streams and other bodies of water in the outfall pipes of sewage treatment plants, or groundwater from septic systems, they can persist for a very long time, adding to the PFAS problem, in particular because these molecules are designed for biological activity.
The authors here focus on the mechanism of degradation of fluorinated compounds using radiation, and explore analytical chemistry techniques in following degradation products.
From the introduction to the paper:
The most common method used for identification of fluorinated degradation products of pesticides and pharmaceuticals is liquid chromatography with nontargeted high resolution mass spectrometry (LC-HRMS). (17) It was reported that using only LC-HRMS to quantify fluorinated compounds can result in fluorine mass balances falling short, with up to 90% of fluorine being unaccounted for. (17−20) Recent studies on fluorinated product formation and identification during photolysis and advanced treatment processes have reported more complete product identification by complementing LC-HRMS with quantitative 19,F-nuclear magnetic resonance spectroscopy (NMR) analysis. (9−11,21,22) An NMR spectrum contains all fluorinated product peaks, and the chemical shifts provide insight into the identity of the functional group and its chemical environment. With the broad range of fluorine NMR shifts (∼400 ppm) and the 100% abundance of 199F isotope of fluorine in the environment, 19F NMR has been reported to be a highly suitable method to detect fluorinated compounds and products. (23) Also, by increasing the number of scans four times, the signal-to-noise ratio is doubled, allowing minor products to be detected. Using 19F NMR to quantify the products formed assists in evaluation of chemical structures identified using the semiquantitative (at best) LC-HRMS data. (10) For example, the photolysis of fluoxetine led to formation of norfluoxetine, TFA, and fluoride. (10) On the other hand, the 19F NMR spectra after photolysis of sulfoxaflor showed that all product peaks formed were similar in shift to the parent peak, indicating that all products were closely related to each other and the parent structurally, making evaluation of product data obtained via LC-HRMS simpler, faster, and more precise. (9) In cases such as this, however, where multiple 19F NMR peaks are within several ppm the parent peak, it is difficult to assign these NMR peaks to the specific structures identified by LC-HRMS to have modifications remote to the fluorinated functional group of interest, which hinders quantifying the relative amounts of different products. (24)
The 19F NMR shifts for common products like fluoride (F–), trifluoroacetate (TFA), and difluoroacetate (DFA) are known and are easily identified and quantified. For new fluorinated product structures formed via degradation of pesticides and pharmaceuticals, it is difficult to predict the upfield or downfield movement of 19F NMR shifts with respect to the parent compounds, thereby potentially making accurate matches of products identified using LC-HRMS with the NMR data challenging and complicated. Major products may go unidentified, unless these products are matched to their 19F NMR shifts. With the unavailability of mass-labeled standards for quantitative mass spectrometry for these newly identified fluorinated products and the difficulty in separating products using preparative scale chromatography, computational calculations for 19F NMR shifts could pave the way for precise and accurate identification of products leading to matches between experimental 19F NMR spectra and LC-HRMS product structures.
Computational methods can be used to obtain 19F NMR shifts for fluorinated organic compounds, even in the absence of standards...
The synthetic difficulty of making PFAS standards is, by the way, profound, and 19F NMR as the authors note can overcome these problems, albeit at the expense of sensitivity.
A graphic in the article gives examples of commercial compounds which feature fluorinated carbons:

The caption:
The radiation used by the authors to study the degradation are as follows: 255, 275, 308, 365, and 405 nm, provided by LEDs and mercury lamps. All of these wavelengths, except the visible violet 405 nm are in the UV range as opposed to the visual range. Our wonderful industrial and agricultural efforts to destroy the ozone layer means that we can be assured of the degradation of these molecules over the long run, albeit at the expense of limiting or completely destroying life on Earth. (Problem solved?)
The results of the experiments and the products are shown graphically in the rather lengthy supplemental information, and happily in some cases, one of the products is the fluoride ion but other fluorinated species, notably the problematic TFA, trifluoroacetic acid, is well represented. Shorter wavelengths, unsurprisingly, are more efficient in general in producing the fluoride ion it seems.
An interesting paper.
Have a nice weekend.
Profile Information
Gender: MaleCurrent location: New Jersey
Member since: 2002
Number of posts: 33,509