Loki Liesmith
Loki Liesmith's JournalTo be honest, Holt improved as a moderator throughout the debate
Still couldn't control things, but at least shaped the agenda.
Gut says someone drops a national poll late tonight
Sure that everyone wants to weigh in before debate.
That CNN poll is looking kind of stale. Wonder if it'll be them.
More Analysis of 538 Results vs. Poll Averages: Is 538 providing added value?
Continued from here.
Technical Stuff: So, I took jpegs of both 538 probability graphs and the Huffington Post poll trendlines (national) from the same interval, used numpy to convert the jpegs into arrays of data and then used a spline from scipy to put both curves onto the same 117 day grid. I then subtracted the Clinton trendline (HuffPo) from the 538 probability estimate for a Clinton Win. I did the same for the Trump numbers.

Results: As you can see, there is VERY LITTLE structure in the residuals (fluctuations after subtracting the poll average, left side plots) as a function of time. Certainly no meaningful temporal structure. So Silver's model extracts no trend apart from poll average. And plotting Trump residuals vs Clinton, it's clear there is no dependency between the two of them. It looks like, apart from the poll average trend, the fluctuations in 538 probabilites are close to zero mean gaussian (noise) process. Small changes in Clinton's win probability have nothing to do with small changes in Trump's probability.
Conclusions: If Silver's model were providing added value over simple poll averages one would expect that, after removing the poll average, a reduction in Clinton's numbers should show some dependence on an increase in Trump's numbers and vice versa. Clearly this is not the case.
Whole thing looks like a random walk.
What am I saying? Nate Silver has argued that his models extract the real signal masked by noisy data. The results here indicate that nearly all of that signal is the smoothed national poll average.
In short, this does NOT inspire confidence that fast changes in the 538 model are anything but noise.
Election Model Update 9/25
9/24 Update9/21 Update
9/22 Update
9/1/2016 update
8/16/2016 update
Update with drift included 8/6/2016
Original Model Writeup 8/3/2016
Model projections:
#############################################
# INSTANTANEOUS MODEL
#############################################
Instantaneous Probability of a Clinton Win: 71.25 %
Mean Electoral Votes Clinton Currently Winning: 291.57
Median Electoral Votes Clinton Currently Winning: 294.0
Maximum Likelihood Electoral Vote Scenario for Clinto: 299
#############################################
# PROJECTING RESULTS TO NOVEMBER
#############################################
Probability of a Clinton Win if Current Trends Continue: 63.29 %
Mean Electoral Votes Clinton Projected to Win: 284.25
Median Electoral Votes Clinton Projected to Win: 285.5
Maximum Likelihood Projected Electoral Vote Scenario: 269
Predicted National Point Spread (Clinton = +, Trump = -) 2.45
538's estimates of probability net us almost ZERO INFORMATION
Just look at this graphic of the national poll average and the 538 probabilities

Maybe, MAYBE the 538 model is squeezing some information out at the margins. I bet I could construct a model that does as well or better than 538 simply by taking the differences in the two poll averages and converting it to a direct probability.
Any movement in this race over the last three weeks is an illusion
Look at this graph of poll outcomes vs when they are in the field:
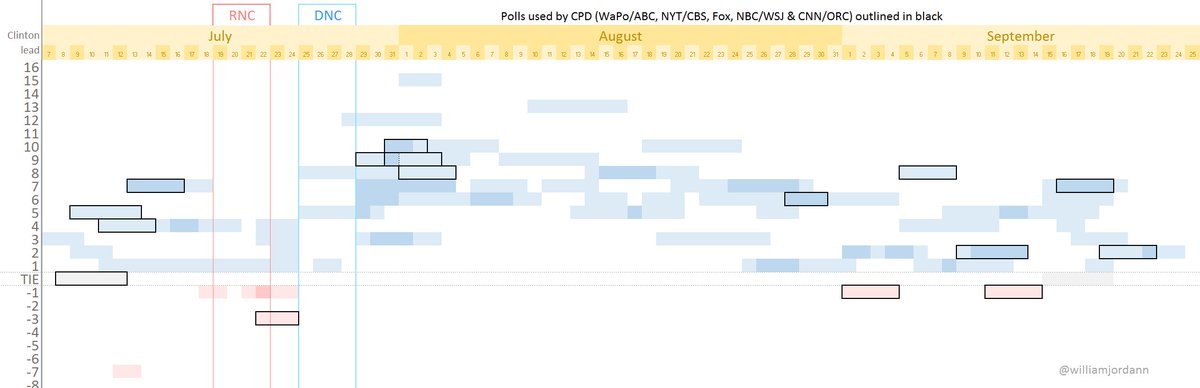 :large
legend:
Position of poll on y axis is size of Clinton Lead.
Intensity of color of boxes is number of polls in field on that interval.
Length of boxes is the period over which the poll is taken.
https://twitter.com/williamjordann/status/780032565176508416
Michigan would be my only worry at this point
Been a while since we've had fresh data from there.
National polls are instructive in that they are highly correlated with movements in many of the states.
Profile Information
Member since: Thu May 26, 2016, 09:07 AMNumber of posts: 4,602