Democratic Underground Latest Greatest Lobby Journals Search Options Help Login
Google

The coming energy gap - how much will wind be able to help?

Printer-friendly format Printer-friendly format
Printer-friendly format Email this thread to a friend
Printer-friendly format Bookmark this thread
This topic is archived.
Home » Discuss » Topic Forums » Environment/Energy Donate to DU
 
GliderGuider Donating Member (1000+ posts) Send PM | Profile | Ignore Tue Feb-05-08 07:47 AM
Original message
The coming energy gap - how much will wind be able to help?
Edited on Tue Feb-05-08 08:21 AM by GliderGuider
I'm a well known pessimist about the potential of wind and solar power to to plug the coming energy gap. In support of my concern, here are some numbers and charts.

First, how much energy is the world going to need over the next few decades? We can find out how much we've used in the past, from the BP Statistical Review of World Energy 2007. The world demand going forward is harder to predict, because we're heading into a time of recession (at least). In the last 20 years the growth in primary energy consumption has averaged about 2% per year. Given the coming uncertainties and the possibility for a global conservation effort, I cut that in half, for a conservative average growth of 1% per year. That gives the following demand curve:


What is the energy supply going to look like over that period? I did a fairly careful analysis last year, that I published in this article. The curve that aggregates the expected supply of oil, natural gas, coal, hydro and nuclear power looks like this:


That will obviously leave a gap:


Now, here is a well-known chart from WWEA showing world wind capacity, installed and planned out to 2010:


Extracting the annual increase in installed capacity gives us this graph for the annual capacity addition:


How does that compare to the requirement created by the gap we saw opening up above? I translated that gap into annual wind capacity installation requirements as follows. First I determined the amount of new energy required each year by subtracting the total demand in the previous year from the total demand in the current year. I then converted MTOE to TWh by multiplying by 4.42, the same conversion factor BP uses in their Statistical Review. I then converted the TWh figure into GW of capacity by first multiplying first by 8.76 to convert TWh of energy to GW of power, then multiplying by 4 to account for a capacity factor of 0.25.

I plotted the resulting curve on the same graph as the actual installation curve shown just above. The result looks like this:


The projected growth in actual wind installations is a second-order polynomial projection, that may turn out to be excessively conservative. Nevertheless, As you can see, a remarkable disconnect begins to develop in the coming decade. With the current increase in installed wind capacity the situation looks increasingly difficult as the decades roll by. I'm not saying it's impossible to plug the gap, but it looks to me as though there will be a massive energy shortfall unless something truly remarkable happens.

In light of this, do you think my pessimism is unfounded?
Printer Friendly | Permalink |  | Top
trof Donating Member (1000+ posts) Send PM | Profile | Ignore Tue Feb-05-08 08:39 AM
Response to Original message
1. My simplistic view:
Wind is variable.
Sun is everyday.

Even in areas of fairly consistent high winds there are calm days.

I'm reading more about photovoltaics that don't require direct sunlight, just 'light'.

Bottom line: Light is more consistent than wind.
Printer Friendly | Permalink |  | Top
 
GliderGuider Donating Member (1000+ posts) Send PM | Profile | Ignore Tue Feb-05-08 09:22 AM
Response to Reply #1
5. What about clouds?
Edited on Tue Feb-05-08 09:24 AM by GliderGuider
Any discussion of wind and solar power have to assume some way of dealing with variability, whether it's though geographic dispersion or energy storage. Having a system that uses a variety of energy sources with different reasons for variability makes the problem easier.

My post implicitly assumes that variability problems can be dealt with. It speaks only to the issue of scale, which is a very different problem.
Printer Friendly | Permalink |  | Top
 
OKIsItJustMe Donating Member (1000+ posts) Send PM | Profile | Ignore Tue Feb-05-08 04:00 PM
Response to Reply #5
13. Clouds aren't necessarily that big of a problem
Printer Friendly | Permalink |  | Top
 
trof Donating Member (1000+ posts) Send PM | Profile | Ignore Tue Feb-05-08 05:28 PM
Response to Reply #13
17. 'Zackly. As long as there's 'light'.
And I've never seen a day with no daylight.
Printer Friendly | Permalink |  | Top
 
GliderGuider Donating Member (1000+ posts) Send PM | Profile | Ignore Tue Feb-05-08 05:32 PM
Response to Reply #17
18. As Anita Bryant used to say:
"A day without sunshine is like ... night."
Printer Friendly | Permalink |  | Top
 
OKIsItJustMe Donating Member (1000+ posts) Send PM | Profile | Ignore Tue Feb-05-08 08:50 AM
Response to Original message
2. Pessimism -vs- Skepticism
I was raised to be a Skeptic. Generally, Skepticism's served me well over the years.

Pessimism on the other hand (like Cynicism) I don't find to be helpful. They lead only to despair.

Your energy demand/shortfall graphs should be altered through the use of conservation. Frankly, as people come to realize that cheap power is a thing of the past, they will learn to conserve.

Your capacity requirement graph should be altered by adding a variety of alternative power sources. Not just wind, but solar (in its many forms) tidal, wave, and (if I dare hope for it) nuclear fusion.
Printer Friendly | Permalink |  | Top
 
GliderGuider Donating Member (1000+ posts) Send PM | Profile | Ignore Tue Feb-05-08 09:18 AM
Response to Reply #2
4. The numbers make me skeptical
Edited on Tue Feb-05-08 09:28 AM by GliderGuider
My knowledge of the evolved neuro-psychological origins of human behaviour are what prompt my pessimism.

What percentage of annual global energy reduction through conservation do you think is realistic? Our economic system shows no sign of changing its underlying requirement of permanent growth. If that continues to be the case, then conservation and efficiency improvement have to be modeled as an improvement in the energy efficiency of the global GDP. As high-return energy sources like oil and gas are used up and gradually replaced by lower-return sources like biofuels and wind turbines, is such an improvement even possible? Some (I among them) argue that it's not possible, that the reduction in aggregate EROEI will cancel out most efficiency and conservation improvements.

There isn't enough history of large-scale solar or tidal installations yet to project a realistic growth curve for either. Solar especially might have a bright future :-) but it's too early to tell. Current global installed solar capacity is only 5% of wind. I used wind as a proxy for all renewables, because it has a very healthy growth curve, and one that can be extrapolated with some degree of confidence. I prefer to base my projections on a reasonable amount of historical data.

The same need for evidence mandates my exclusion of fusion -- let's get a couple of reactors up and running, and see where we're at.
Printer Friendly | Permalink |  | Top
 
OKIsItJustMe Donating Member (1000+ posts) Send PM | Profile | Ignore Tue Feb-05-08 03:36 PM
Response to Reply #4
10. A tautology, people cannot use any more energy than is available
Your graphs make the implicit assumption that energy demand/use will continue to increase at its current rate.

Clearly, this cannot happen.

Given that, your graphs amount to the disparity between present day dreams and future reality. Once energy supplies become constrained, energy use will drop. People will have a limited number of options at that point.
  1. They can attempt to continue to live as they have. More and more people will not be able to.
  2. They can learn to live in a way that requires less energy. (They will have to do this.)

Once the shortfall starts to occur on your graphs, energy use will decrease, so I feel it's misleading to keep plotting Energy Demand past 2015 as if nothing had happened. People's expectations will change, energy use will decrease. There will be no choice.
Printer Friendly | Permalink |  | Top
 
GliderGuider Donating Member (1000+ posts) Send PM | Profile | Ignore Tue Feb-05-08 04:50 PM
Response to Reply #10
14. I agree completely.
The point of this exercise is to give some shape to just how unrealistic the expectation of Business as Usual through renewable energy really is.

If you accept my original energy supply graph as realistic, then you come immediately and inescapably to your conclusion.

However, there are many people (some even on this board) who do not accept that my analysis reflects reality. They assume (hope, pray, clap for the possibility) that our civilization will be able to continue on some sort of "normal" path through the use of wind, solar or tidal power. It is those people that are the audience for this analysis.
Printer Friendly | Permalink |  | Top
 
diane in sf Donating Member (1000+ posts) Send PM | Profile | Ignore Wed Feb-06-08 02:01 AM
Response to Reply #14
26. You can't assume a straight line increasing demand for energy use. Buckminster Fuller noted
in the 70's that every 20 years or so that machinery of all sorts got totally replaced, including the machinery to make other machinery. Every time this happens the new machinery uses less physical material and takes less energy to operate.

Demand can also be flexible. When the energy criminals from Texas started raping California the demand for electricity went down 10% immediately. That was just based on behavior change using current technology. Structural stuff for reducing energy can be fast--replacing appliances and lightbulbs, medium: replacing windows, adding insulation, somewhat slower: adding wind and solar by households and community. But exponential growth in all of these things can get you where you want to go faster than your projections indicate.

UN projections show the world's population stabilizing by mid-century and then slowly decreasing. This will bring a whole new interesting set of problems. One reason for the push for growth at all costs is to hide the effects of income inequity and piggery at the top and preventing rebellion from the peasants (you and me).

I'm reading a very interesting book by Bill McKibben called Deep Economy: The Wealth of Communities and the Durable Future. He talks about Cuba where they had to go off oil cold turkey. They had a calorie deficit of about 1/3 per person for several years until they got their organic urban farms online (no petroleum inputs). One of the fastest growing agricultural segments in the US right now is farmers markets in urban centers. Most big cities have enough arable land within 100 miles to produce a large proportion of the agricultural products needed by their residents. And they create a lot of sewage and organic waste that could be used in the vicinity to help grow things. San Francisco's compost gets sold to farmers in the wine country among other places. Everyone could be doing that. There are a lot of energy and material loops that could be closed. Nature is the model and nature has no garbage.

We are currently wasting a large part of the energy we use and we have a lot of room to do as much or more with what we have without much pain.
Printer Friendly | Permalink |  | Top
 
GliderGuider Donating Member (1000+ posts) Send PM | Profile | Ignore Wed Feb-06-08 07:14 AM
Response to Reply #26
27. World primary energy demand has only declined in 3 of the last 40 years
Those years were 1980, 1981 and 1982 - years of the Iran-Iraq war and the tanker wars in the Straits of Hormuz. According to BP, the average annual increase over 40 years, including those 3 years of decline, has been just shy of 2%.

Keep in mind that what I'm presenting is not a prediction, it's a scenario. I'm saying "If this were to happen, it would imply that." I'm not saying growth will continue, I'm saying that if it did, the energy gap I describe could be a result.

I'm not at all comfortable with the idea that increased efficiency in energy use would result in lower energy demands. After all, the energy intensity of the US economy has improved by almost 2% per year over the last few decades, and energy consumption has never declined for more than one year in a row except due to external influences like the OPEC oil embargo or the Iran-Iraq war.

There's no question that North Americans waste a lot of energy. I'm just not convinced that reducing that waste will result in a slowdown in the world's energy demand. One of the reasons I'm doubtful is because of the Jevons Paradox:

In economics, the Jevons Paradox is an observation made by William Stanley Jevons, that as technological improvements increase the efficiency with which a resource is used, total consumption of that resource may increase, rather than decrease. It is historically called the Jevons Paradox as it ran counter to Jevons's intuition. However, the situation is well understood in modern economics. In addition to reducing the amount needed for a given output, improved efficiency lowers the cost of using a resource – which increases demand. Overall resource use increases or decreases depending on which effect predominates

This doesn't mean we shouldn't cut waste, improve efficiency and conserve. All those things will make our lives less expensive and more sustainable. However, we shouldn't be surprised when those efforts don't reduce global (or even national) energy consumption.
Printer Friendly | Permalink |  | Top
 
The2ndWheel Donating Member (1000+ posts) Send PM | Profile | Ignore Wed Feb-06-08 09:21 AM
Response to Reply #26
32. Yet we use more energy today than ever
"Every time this happens the new machinery uses less physical material and takes less energy to operate."

What happens to the energy that is saved every time that happens? Does it stay in the ground? No. We just it for different things. Each individual product may use less material and energy, but we make more of them. That's the point of mass production. We may only be able to make X amount of widgets, but then we make wadgets, and then wudgets, and then wodgets, and then wizlits, and then we get really good and start making gafigglefats, and then we find that we can increase the amount of differents types of products and come up with wadinkers, yafuzzles, and farfinkers. Then we have ham. We are the Who's of Whoville.
Printer Friendly | Permalink |  | Top
 
OKIsItJustMe Donating Member (1000+ posts) Send PM | Profile | Ignore Wed Feb-06-08 11:54 AM
Response to Reply #26
33. On my way to work...
I noticed, while waiting for a traffic light, that the red and green bulbs had been replaced by LED clusters, but the amber bulb had not. Clearly, they're being upgraded through attrition. (The amber lights are lit for a shorter period of time, and have therefore lasted longer.)

They're avoiding the expense of replacing all of the bulbs at once. However, with time, the transition will be complete.
Printer Friendly | Permalink |  | Top
 
OKIsItJustMe Donating Member (1000+ posts) Send PM | Profile | Ignore Tue Feb-05-08 10:14 PM
Response to Reply #4
23. EROI of Alternative Energy
Edited on Tue Feb-05-08 10:33 PM by OKIsItJustMe
http://www.theoildrum.com/story/2006/10/17/18478/085
http://www.eoearth.org/article/Energy_return_on_investment_(EROI)_for_wind_energy
...


...

This article reviews 112 wind turbines from 41 different analyses, ranging in publication date from 1977 to 2006. This survey shows average EROI for all studies (operational and conceptual) of 24.6 (n=109; std. dev=22.3). The average EROI for just the operational studies is 18.1 (n=158; std. dev=13.7). This places wind energy in a favorable position relative to conventional power generation technologies in terms of EROI.

...


http://www1.eere.energy.gov/solar/clean_energy_payback.html
We have to use energy to manufacture and produce PV systems. But since that energy can come from either environmentally friendly or unfriendly sources, environmental impacts are difficult to quantify. To avoid that uncertainty, PV experts prefer to evaluate the "energy payback" of PV systems, that is, how long it takes a PV system to generate enough zero-emission energy to offset the energy used to produce it.

Studies have shown that, depending on the type of PV technology, the clean energy payback of a PV system ranges from one to four years. With life expectancies of 30 years, 87% to 97% of the energy produced by PV systems will be free of pollution and greenhouse gas emissions. For more information, see the NREL report, "Energy Payback: Clean Energy from PV" (PDF 75 KB). Download Adobe Reader.

In other sources, a Dutch report from Utrecht University, places the energy payback at 1.3 to 4.6 years, and a report by Energy & Environmental Economics, Inc., and Siemens Solar Industries published in Home Power Magazine found energy paybacks ranging from 1.8 to 4.1 years (PDF 132 KB). Download Adobe Reader. Additional papers on the PV energy payback are available on the Ecotopia Web site.


http://www1.eere.energy.gov/solar/myths.html#6
...

Myth 6: PV is too expensive and will never compete with "the big boys" of power generation. Besides, you can never get the energy out that it takes to produce the system.

The cost of producing PV modules, in constant dollars, has fallen from as much as $50 per peak watt in 1980 to as little as $3 per peak watt today. This causes PV electricity costs to drop 15¢-25¢ per kilowatt hour (kWh), which is competitive in many applications.

In the California market, where state incentives and net metering are in place, PV electricity prices are dipping below 11¢/kWh, on par with some utility-delivered power. Moreover, according to the U.S. PV Industry Roadmap, solar electricity will continue this trend and become competitive by 2010 for most domestic markets (PDF 674 KB). ...

The energy payback period is also dropping rapidly. For example, it takes today's typical crystalline silicon module about 4 years to generate more energy than went into making the module in the first place. The next generation of silicon modules, which will employ a different grade of silicon and use thinner layers of semiconductor material, will have an energy payback of about 2 years. And thin-film modules will soon bring the payback down to one year or less. This means that these modules will produce "free" and clean energy for the remaining 29 years of their expected life.
Printer Friendly | Permalink |  | Top
 
GliderGuider Donating Member (1000+ posts) Send PM | Profile | Ignore Tue Feb-05-08 10:39 PM
Response to Reply #23
24. The EROEI of wind and solar may indeed turn out to be quite good
For me their problem is not EROEI but scale. The dominant energy sources over the next 30 years are going to remain oil, gas, coal, hydro and a bit of nuclear. Of those five, hydro has pretty much hit its limits, nuclear is going to go through a period of contraction due to decommissioning, and the fossil fuels all suffer from declining EROEI already. In that mix, adding another 10% or 15% of a high-return source won't make much difference to the decline of the aggregate energy return.
Printer Friendly | Permalink |  | Top
 
hunter Donating Member (1000+ posts) Send PM | Profile | Ignore Tue Feb-05-08 03:38 PM
Response to Reply #2
11. This economy is toast.
Time to build a new one. Or not.

Nature doesn't care if we are skeptics, pessimists, cynics, or wild eyed optimists. We fell off the horse and gravity rules. When we hit the ground, it's gonna hurt.
Printer Friendly | Permalink |  | Top
 
OKIsItJustMe Donating Member (1000+ posts) Send PM | Profile | Ignore Tue Feb-05-08 03:56 PM
Response to Reply #11
12. I guess you don't understand the difference in terms
Edited on Tue Feb-05-08 03:57 PM by OKIsItJustMe
Cynic - a faultfinding captious critic; especially : one who believes that human conduct is motivated wholly by self-interest
Pessimist - an inclination to emphasize adverse aspects, conditions, and possibilities or to expect the worst possible outcome

Both of these are purely negative outlooks.

The Skeptic doubts and tests the assumptions and assertions made by Cynics, Pessimists and Optimists.

So, in this case, I say, things look bleak, but perhaps not as bleak as you say.

GG's assumptions are based on humanity being essentially mindless. This we know not to be the case, since he is not mindless. (So, unless GG is a mutant, we must assume that there are also others who are not mindless.)

Let us assume for a moment that you and I are also not mindless. (Once again, we could mutants, but what are the odds.)


Let us instead work on the assumption that just as we all can grasp the challenges that face us, that the rest of humanity is capable of understanding them as well.
Printer Friendly | Permalink |  | Top
 
GliderGuider Donating Member (1000+ posts) Send PM | Profile | Ignore Tue Feb-05-08 05:03 PM
Response to Reply #12
16. A minor quibble
It's an overstatement to say that I think humanity is essentially mindless. I emphatically do not.

I think that we suffer from a set of evolved behavioural predispositions that are proving to be counterproductive for an intelligent creature at the top of a planetary food chain. These are just predispositions, though, not axiomatic constraints, so some of us can overcome them to greater or lesser extents. It seems to be easier to overcome them as individuals than as groups, however, primarily because the urge to compete takes over in groups. Unfortunately, 6.6 billion humans is one hell of a big group (or group of groups of groups, which is even worse).

And of course there's the confounding problem that we as groups and as individuals are much more clever than we are wise.
Printer Friendly | Permalink |  | Top
 
OKIsItJustMe Donating Member (1000+ posts) Send PM | Profile | Ignore Tue Feb-05-08 06:08 PM
Response to Reply #16
20. Education can be a wonderful thing
People too often apologize for asking me "stupid questions" about computers. I frequently reply that their questions don't come from stupidity, but from ignorance. I can't do much about stupidity, but ignorance I can fix.

The response to An Inconvenient Truth was tremendous, and really, all it was, was education. For those of us who've been paying attention, there really was nothing new in it. The only thing new about it was that people were being told and shown the truth in a way they could comprehend.


I believe the biggest problem we face in the US regarding climate change is that there are too many people who are willing to lie, and too many people who are willing to embrace the lies. The more people know the truth, and accept the truth, the more willing they will be to act.

You're correct about our natural inclination to compete. (For example) we don't want to sign Kyoto, unless the Chinese do as well. I like to think (however) that our innate competitiveness can be channeled productively. (That's what got us to the moon.)

I think that those who are presenting alternative energy technologies in a competitive fashion, "See what the Europeans are doing? etc." are on a good tack.
Printer Friendly | Permalink |  | Top
 
hunter Donating Member (1000+ posts) Send PM | Profile | Ignore Tue Feb-05-08 05:52 PM
Response to Reply #12
19. Energy: It doesn't matter what we think. It matters what is.
We've gone long past the point where any particular technology, or even a variety of technologies, can solve the problems we've created for ourselves.

The energy problem is immediate. The behaviors of the oil companies and oil exporting nations are entirely consistent with peak oil. If it was some grand conspiracy to raise prices someone could make instant billions by betting against the conspirators.

The problem with peak oil is that it changes the economics of everything. Before peak oil it is highly worthwhile to use the profits of oil obtained at little cost to finance the extraction of more costly oil. Inexpensive and easily extracted oil and natural gas supported the economic infrastructure that could build very complex and expensive extraction technologies like deep sea oil platforms or remote arctic oil fields. Past the peak there's more profit to be made by doling out the oil you've got. Investing in further exploration is less likely to increase your market share or your profits.

I visualize a bell curve in which the toe of the lower priced oil chases the toe of the higher priced oil over time. Before peak oil the upper toe was moving faster than the lower toe. After peak oil the lower toe starts to catch up with the upper toe, the volume of the oil market contracts, and at some point the whole thing becomes so narrow it collapses catastrophically because the economy no longer has the resources to support oil production of any kind.

When I look at wind power I see instabilities of a similar sort. By my own rough calculation the industrial capacity required to build and maintain wind generators can't be supported by wind power alone. If a place like Germany, which is devoting substantial resources to solar and wind power, began to reduce their use of coal and nuclear power they wouldn't have the economic resources to increase their use of wind and solar. The only reason Germany has the economic resources to devote to solar and wind development is that they are increasing their use of coal.

Look at this monster in Germany:


The energy to build and maintain these is derived from fossil fuels. It's conceivable you could build and maintain such a thing using electricity that is produced by other windmills of this sort, but it's not at all certain it would be worth the effort.

The machine produces enough electricity to supply "5,000" homes, but do the occupants of those 5,000 homes have the economic resources to support such a machine? I don't think so. Without subsidy of some sort such a machine would quickly become inoperable. All over the world there are towns of 5000 homes that don't have the resources to install and maintain simple potable water systems of the sort you could build with parts purchased at Home Depot. But the only reason those parts and Home Depot exist is that fossil fuels are still inexpensive. Without inexpensive fossil fuels simple things like clean water in your taps suddenly become much more pressing problems than the maintenance of giant windmills.

Yeah, I am a pessimist. It's entirely conceivable we could find ourselves in a bad situation where it makes some kind of sick sense to chop apart our neighbors with machetes. Maybe that's what the U.S. is doing in Iraq.

The only thing that gets us past this bottleneck in a civilized fashion is to recognize and respect the human rights of everyone -- even people who are our enemies. If we can't do that it really doesn't matter how many windmills or solar panels we have.

Printer Friendly | Permalink |  | Top
 
OKIsItJustMe Donating Member (1000+ posts) Send PM | Profile | Ignore Tue Feb-05-08 11:02 PM
Response to Reply #19
25. It also matters what we do
The Pessimist does nothing, but bewail the situation.
The Cynic blames everyone else.
The Optimist says, "What can we do to improve the situation?"

Any action is by its nature optimistic, since it is an attempt to improve the overall state of things.
Printer Friendly | Permalink |  | Top
 
GliderGuider Donating Member (1000+ posts) Send PM | Profile | Ignore Tue Feb-05-08 09:04 AM
Response to Original message
3. A point of clarification on that last graph
Edited on Tue Feb-05-08 09:05 AM by GliderGuider
As long as the curve of actual capacity additions stays below the curve of required additions, the shortfall in cumulative capacity will continue to grow. Only once the installation curve rises to meet the requirement curve does the gap stop increasing. Then, mathematically speaking, installations would need to consistently exceed requirements to reduce the supply-demand shortfall. In the scenario above, it looks as though the gap would stop growing in about 2060 or so.
Printer Friendly | Permalink |  | Top
 
jpak Donating Member (1000+ posts) Send PM | Profile | Ignore Tue Feb-05-08 09:43 AM
Response to Original message
6. If the assumption is that wind generated electricity has to replace oil for transportation
Edited on Tue Feb-05-08 09:50 AM by jpak
the analysis is flawed.

And if the analysis assumes that wind is the *only* renewable energy source to replace fossil fuels, it is further flawed.

And if the analysis assumes that transportation petroleum demand is inelastic and will increase with increasing petroleum prices and availability, the analysis is further and further flawed.

:popcorn:

Oh yeah, the assumption that wind farm capacity factors are 0.25 is way too low and at odds with all the empirical evidience...

:)
Printer Friendly | Permalink |  | Top
 
GliderGuider Donating Member (1000+ posts) Send PM | Profile | Ignore Tue Feb-05-08 10:58 AM
Response to Reply #6
7. Flawed? Let's take a look.
Edited on Tue Feb-05-08 11:30 AM by GliderGuider
On the capacity factor, here's the reason I used 25%:

http://www.windpower.org/en/tour/wres/annu.htm

Capacity factors may theoretically vary from 0 to 100 per cent, but in practice they will usually range from 20 to 70 per cent, and mostly be around 25-30 per cent.

I assumed that since we'll be putting up wind around the world, that the amount required will necessarily require building in some less-than-ideal locations (say in Africa or much of South Asia). As a result, coming in on the low end of the first standard deviation for the aggregated global picture seems reasonable. Also, take another look at my last graph - would going from 25% to 30% capacity really change the picture?

Regarding transportation:

A bit less than 70% of oil is used for transportation. Natural gas (which contributes to the total energy gap) is a very minor player in that application, it's used mainly for electricity, process heat and petrochemicals. As a result the overall impact of the higher efficiency of EV vs. ICE is diluted. In addition, the conversion factor of 4.42 TWh(e)/mtoe applied by BP is significantly lower than the thermal energy of oil (11.63 TWh(th)/mtoe per http://en.wikipedia.org/wiki/Ton_of_oil_equivalent), so that conversion factor already takes into account the higher efficiency of electricity, and certainly much of the improved efficiency of electric cars.

The own-price elasticity of transportation fuel is actually quite low (demand is very inelastic). I've read numbers of -0.1 for developed nations, meaning that a 10% increase in fuel prices would result in only a 1% drop in demand. Even that figure seems too high in the short term given the fact that North American driving habits really haven't changed appreciably as gasoline prices have risen over the last couple of years. Part of that may be due to the lack of available substitutes like electric cars, but that's the picture at the moment. The reason I think it's unlikely to change much in the near term is that fuel costs are still a small part of family budgets, meaning that gasoline prices would need to rise a lot before most people saw economic sense in investing in a new type of vehicle. I don't expect such a shift to be widespread before the next vehicle replacement cycle is over in 15 years.

One last point is that some of the energy gap is due to the decommissioning of older nuclear reactors at end-of-life, with insufficient construction to replace them. Any energy lost from that source has to be directly replaced by electricity from another source, with no source-related efficiency improvements available.

These traditional quibbles don't cut much ICE unless one can demonstrate that they will quadruple or quintuple the projected energy replacement value of wind power (or other renewables) over the next 30 years. So far I've seen a lot of hopes and expectations, but little evidence.
Printer Friendly | Permalink |  | Top
 
NNadir Donating Member (1000+ posts) Send PM | Profile | Ignore Tue Feb-05-08 11:03 AM
Response to Original message
8. You're confusing power and energy.
MTOE is an energy unit. MW is a power unit.

If I install 1000 MW of wind power in the doldrums, it may not produce as much energy as a 50 MW gas plant.
Printer Friendly | Permalink |  | Top
 
GliderGuider Donating Member (1000+ posts) Send PM | Profile | Ignore Tue Feb-05-08 11:10 AM
Response to Reply #8
9. Your reading comprehension is flawed this morning.
Please re-read this bit:

I then converted MTOE to TWh by multiplying by 4.42, the same conversion factor BP uses in their Statistical Review. I then converted the TWh figure into GW of capacity by multiplying first by 8.76 to convert TWh of energy to GW of power, then multiplying by 4 to account for a capacity factor of 0.25.

Please don't assume everyone on here but you is an innumerate idiot.
Printer Friendly | Permalink |  | Top
 
NNadir Donating Member (1000+ posts) Send PM | Profile | Ignore Tue Feb-05-08 09:57 PM
Response to Reply #9
22. Apologies. I'm just yet so used to the confusion between power and energy...
Edited on Tue Feb-05-08 10:02 PM by NNadir
that I really don't go that far into most of the text.

I read quite quite a bit in a variety of fields. It would be safe to say that I read in every spare minute of time I have in fact.

I use old fashioned Evelyn Wood type speed reading, techniques that are based on adjusting attention to detail for the level of difficulty of the text. I have easily read many thousands of documents of the "wind will save us" type and 95% of them, maybe more, begin with discussions of "watts," specifically peak watts. This is so clearly illiterate and nevertheless so common that I almost certainly downgrade the level of reading I devote to "wind will save us" text.

Basically though, I do assume innumeracy in most discussions of energy.

It's generally a safe bet. I am seldom caught flat footed as I have been in this case, where I missed the sentence that changes the meaning.

In fact, in a typical day, if I read 1000 popular paragraphs about energy, it is somewhat surprising if 5 of them are either accurate or perceptive.

I'll go further. With out generalized innumeracy there would be much less of problem with energy.

Wind power - or wind energy - is irrelevant to the world's energy demand in any case. At this point the question is hardly worth asking.

It is immediately clear to anyone who is looking that wind energy has yet to produce an exajoule of energy and further that the quality of the energy - load following - is very low.

I will say this: Anyone assuming that the average capacity utilization of wind power will remain as high as 25% is ignoring several factors, the first being spinning reserve - which actually reduces further the true capacity from the apparent capacity utilization of wind - and secondly the fact that the picking of the low hanging wind fruit is already nearing saturation.

Wind capacity utilization is not as high as 25% in the US. It is now about 22%, not that it makes a huge difference because wind remains a trivial form of energy.

There are wind facilities around that produce less than 10% of their nameplate capacity, some of which - the Glaxo facility in the UK comes to mind - which are merely built for dumb public relations purposes.

Wind power has never kept pace with the rise in world demand for fossil fuels, which is also self-evident. In fact, all of the magic renewables combined have not kept pace with the rise in fossil fuel use.
Printer Friendly | Permalink |  | Top
 
jpak Donating Member (1000+ posts) Send PM | Profile | Ignore Wed Feb-06-08 08:31 AM
Response to Reply #22
28. Wrong again - wind power will produce an ex-o-jewel of electricity this year
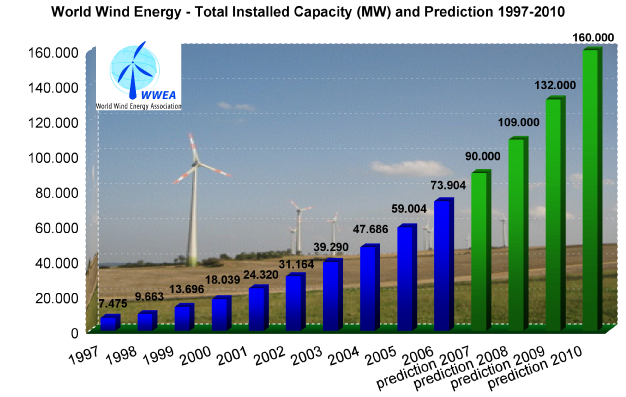
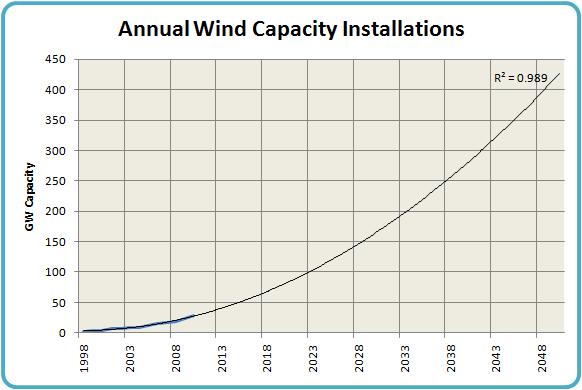
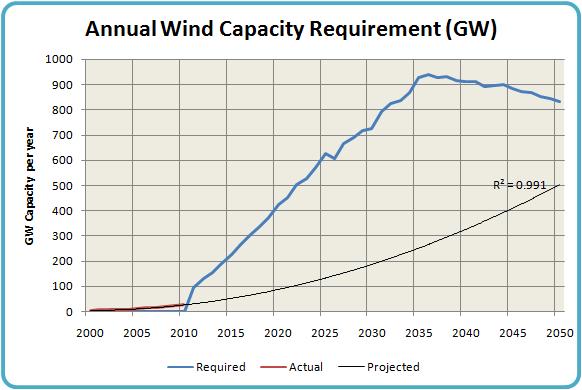
Global wind power generating capacity currently exceeds 92 GW and will increase to more than 100 GW this year and easily produce 1 EJ or more of electricity.

Global additions of new wind turbine capacity outpaced additions new nuclear capacity in 2006 and 2007 by wide margins.

Furthermore, wind turbine capacity factors are commonly 25-35% - not 22%.

Those who do not understand the physics and engineering of wind turbines always compare apples to oranges when discussing wind turbine capacity factors...

http://www.windpower.org/en/tour/wres/annu.htm

<snip>

The Capacity Factor Paradox

Although one would generally prefer to have a large capacity factor, it may not always be an economic advantage. This is often confusing to people used to conventional or nuclear technology.

In a very windy location, for instance, it may be an advantage to use a larger generator with the same rotor diameter (or a smaller rotor diameter for a given generator size). This would tend to lower the capacity factor (using less of the capacity of a relatively larger generator), but it may mean a substantially larger annual production, as you can verify using the Power calculator on this web site.
Whether it is worthwhile to go for a lower capacity factor with a relatively larger generator, depends both on wind conditions, and on the price of the different turbine models of course.

Another way of looking at the capacity factor paradox is to say, that to a certain extent you may have a choice between a relatively stable power output (close to the design limit of the generator) with a high capacity factor - or a high energy output (which will fluctuate) with a low capacity factor.

<more>

http://www.energyadvocate.com/fw92.htm

<snip>

Consider, for example, a wind turbine of 23-meter radius. In a 25-m/s wind, it could hypothetically produce 8.3 MW of electricity.

The Enron Type Z-750 wind turbine has a 23-m radius. It is rated at 750 kW, not 8.3 MW. The machine is designed to produce 750 kW of electrical power for all speeds in excess of about 11 or 12 m/s. Its expected capacity factor in a wind farm in Minnesota is about 35%.

If the wind turbine were rated at 14 m/s, the nameplate power would be about 1.5 MW instead, but the power delivered to the grid would still be about the same. Its capacity factor would be 17% (possibly a bit higher, depending upon windspeed distribution) instead of 35%.

Early wind turbine manufacturers (and proponents) tended to emphasize nameplate power. More recently, they have gone for relatively constant power (at least in higher winds) and higher capacity factors.

<more>

Generator Ratings & Capacity Factors: Why You Should Avoid Them

http://www.wind-works.org/articles/generatorratingandcapacityfactors.html

<snip>

Annual generation per turbine or Annual Energy Output (AEO) is used by developers, investors, farmers, and homeowners to gauge performance because it is easily understood and directly comparable to performance projections. If a homeowner is buying a single turbine, the projected generation per unit will clearly state how much energy can be expected. In the same way the homeowner can also easily monitor performance by comparing what the turbine did deliver with what was expected. In the end, annual generation is what matters to the owner or investor.

Annual generation per unit of capacity in kilowatt-hour per kilowatt of rated capacity is more useful to project planners where a broad measure of productivity is more important than the number of specific machines. This measure is easily convertible to total expected generation once the total project capacity in MW is known. The 1.8 MW turbine in the previous example produces about 2,500 kWh/kW of capacity at a 7 m/s site. This figure of merit, like capacity factor, is influenced by the rated capacity.

Annual capacity factor is a related parameter in common use within the electric utility industry and is percentage of actual generation compared to the potential generation if the wind turbine operates at rated power for the entire year. It, too, is dependent upon the rated capacity. The 1.8 MW turbine in the example delivers a capacity factor of nearly 30% at a 7 m/s site. Because manufacturers rate their wind turbines at different wind speeds, capacity factors are useful only when the specific capacity of the turbines in kW/m² are known.

<more>

Those who do not - or cannot - understand this are scientific illiterates and Dick Cheney nuclear shills...

Printer Friendly | Permalink |  | Top
 
GliderGuider Donating Member (1000+ posts) Send PM | Profile | Ignore Wed Feb-06-08 08:45 AM
Response to Reply #28
29. There's a problem with your enthusiatic rebuttal
NNadir wasn't talking about individual turbine capacity factors when he mentioned 22% - he was talking about the aggregate capacity factor of all wind generation facilities in the USA. For instance this would include installations like the Altamont Pass wind farm, whose capacity factor is calculated here as 12.4%.

As that site mentions, it's probably hard to get accurate capacity factor numbers, because actual generatiion figures are regarded by many wind farm operators to be commercially confidential.

It doesn't surprise me that aggregate capacity factors would fall below the theoretical factors for individual turbines, since many of them will be installed in less-than-ideal locations for public relations or political motives.
Printer Friendly | Permalink |  | Top
 
jpak Donating Member (1000+ posts) Send PM | Profile | Ignore Wed Feb-06-08 08:49 AM
Response to Reply #29
30. What??
"It doesn't surprise me that aggregate capacity factors would fall below the theoretical factors for individual turbines, since many of them will be installed in less-than-ideal locations for public relations or political motives."

Please - there are 92 GW of *commercial* *utility-grade* wind turbines in operation in the world today - your statement is absolutely and laughably false.
Printer Friendly | Permalink |  | Top
 
NNadir Donating Member (1000+ posts) Send PM | Profile | Ignore Wed Feb-06-08 05:36 PM
Response to Reply #30
40. And your statement is laughably and absolutely (and typically) not cognizant
of the difference between energy and power.
Printer Friendly | Permalink |  | Top
 
NNadir Donating Member (1000+ posts) Send PM | Profile | Ignore Wed Feb-06-08 01:05 PM
Response to Reply #28
34. The EIA data - as opposed to industry advertising - is pretty clear on the capacity utilzation.
I'd report the data, but it would involve math, and over the years we've seen how good you are at math.

Printer Friendly | Permalink |  | Top
 
GliderGuider Donating Member (1000+ posts) Send PM | Profile | Ignore Wed Feb-06-08 01:36 PM
Response to Reply #34
35. The numbers don't lie
According to AWEA, the USA had 9,149 MW of installed wind capacity in 2005.
Therefore generation at 100% of capacity would have produced 9,149*8,760 = 80,145,240 MWh.

According to the EIA, the USA actually generated 17,810,549 MWh of wind electricity in 2005.

Actual generation was therefore 17,810,549/80145,240 = 0.2222 of full capacity.

22.22% of nameplate capacity.

Thanks. I now agree that my estimate of 25% was optimistic.
Printer Friendly | Permalink |  | Top
 
Dead_Parrot Donating Member (1000+ posts) Send PM | Profile | Ignore Wed Feb-06-08 01:52 PM
Response to Reply #35
36. A cautionary note...
If that was 9,149 MW installed at the end of 2005, it would include a fair chunk built during the year - which would therefore not have been on line for 8,760 hours.

Best wrangling I can suggest is 2004 capacity x 8,760, and built-in-2005 capacity x 4,380. It should nudge the figures up a percent or two.
Printer Friendly | Permalink |  | Top
 
GliderGuider Donating Member (1000+ posts) Send PM | Profile | Ignore Wed Feb-06-08 02:00 PM
Response to Reply #36
37. Good catch.
Edited on Wed Feb-06-08 02:04 PM by GliderGuider
I stated wondering about exactly that after I posted this. I recalculated using your approach, which seems sound, and came out with 25.6%

So, the original estimate of 25% looks reasonable after all. Thanks for your help.

Printer Friendly | Permalink |  | Top
 
Dead_Parrot Donating Member (1000+ posts) Send PM | Profile | Ignore Wed Feb-06-08 02:16 PM
Response to Reply #37
38. Of course, you realise...
...That you will now be buried under a pile of posts claiming that the extra 0.6% makes all the difference, and that your figures are worthless... :D
Printer Friendly | Permalink |  | Top
 
GliderGuider Donating Member (1000+ posts) Send PM | Profile | Ignore Wed Feb-06-08 02:35 PM
Response to Reply #38
39. If I were a critic
I'd have a lot more reservations about that 1% economic growth rate, the probability of a depression actually putting the global economy into reverse for the next 30 years, and the validity of the polynomial projection I used for wind power capacity growth.

But no, let's niggle over whether an "average" turbine puts out 25% or 30% of its rated power...
Printer Friendly | Permalink |  | Top
 
jpak Donating Member (1000+ posts) Send PM | Profile | Ignore Thu Feb-07-08 10:58 AM
Response to Reply #35
41. The EIA data cannot be used to accurately estimate wind power capacity factors
The US had 6740 MW of installed wind capacity at the end of 2004 and added 2431 MW of new capacity by the end of 2005.

Not all of that new wind capacity produced electricity in 2005 - in fact most of the wind generated electricity produced in 2005 was produced from turbines installed in 2004.

A more accurate (but still flawed) method of estimating US wind turbine capacity factors is to use 2004 installed capacity and 2005 wind electricity production.

If those numbers are used, US wind turbine capacity factors in 2005 were >30% - not 22%.

The only valid method that can be used to estimate turbine capacity factors is to use data from *existing* *operational* wind farms operating over several years.

The wind industry has conducted these tyoes of studies and reported the data. The bottom line is this: in the real world, operational wind turbines have capacity factors of 25-50% with most values in the range 30-35%.

Furthermore, progress in wind turbine engineering is producing more efficient and reliable machines that can operate under lower speed wind regimes - future wind capacity factors will increase with time from the current (and real) 30-35% average.

nice try though

:evilgrin:
Printer Friendly | Permalink |  | Top
 
GliderGuider Donating Member (1000+ posts) Send PM | Profile | Ignore Thu Feb-07-08 11:09 AM
Response to Reply #41
42. You really must keep up with the discussion
Edited on Thu Feb-07-08 11:21 AM by GliderGuider
In two posts above this, Dead_Parrot and I discussed exactly this issue. We agree that there's some uncertainty, but felt that using the 2004 end-of-year capacity plus half the end-of-year 2005 capacity gave a more reasonable estimate than using just the EOY 2004 or EOY 2005 numbers. Using that approach, I calculated a capacity factor of 25.6%.

I also noted that in terms of the point of the original post, this digression is a meaningless red herring. The original point was that you can't fill a gallon bottle with a pint of liquid.
Printer Friendly | Permalink |  | Top
 
GliderGuider Donating Member (1000+ posts) Send PM | Profile | Ignore Tue Feb-05-08 04:54 PM
Response to Original message
15. I've posted a cleaned-up version of this article on my web site.
http://www.paulchefurka.ca/EnergyGap.html

It includes my responses to the various objections that were raised in this thread. I want to thank the critics for giving me an opportunity to clarify some the the thinking that went into this piece
Printer Friendly | Permalink |  | Top
 
losthills Donating Member (1000+ posts) Send PM | Profile | Ignore Tue Feb-05-08 08:50 PM
Response to Original message
21. People who are casting about .....
for ways to keep an unsustainable system going are going to be continually frustrated. You just have to ask yourself, "What part of unsustainable are they not grasping?"

Today, we waste more energy than what we use. We continue to build houses that require heating or cooling every day of the year, when we know how to build houses that don't. And we continue to build suburbs farther and farther from workplaces. We still build houses with gas or electric water heaters and no passive solar system. There are cars on the road now that get 100 miles per gallon, but no nation will mandate that as a standard. Look around you: Energy Conservation is not happening. And yet energy conservation alone could eliminate the need for new power sources in every country for a long , long time....

Energy Company lobbyists constantly point their fingers at wind and solar powers' so-called "intermitancy" as if it's some kind of a deal breaker. It's not. There are lots of ways around it, and most of them have been discussed here many times. "Intermitancy" is not worth addressing any more, because it's not a problem.

While the lobbyists are moaning and bellyaching about all of wind and solar powers' propagandistically perceived shortcomeings, guess what? Those two sustainable power sources are growing by leaps and bounds because real people are seeing what they can do and they are making real world sense. They are growing because they work.

"Pessimism" towards wind and solar power is unfounded according to what I am reading and what I am seeing with my own eyes. "Irrational" might even be a better word.

But pessimism about our goverments' ability to come to terms with the unsustainability of our culture is not unfounded or irrational. The solutions to our collective dilemma have got to be mandated by government. All governments working together. Otherwise we are going down, and no energy source is going to save us.....
Printer Friendly | Permalink |  | Top
 
The2ndWheel Donating Member (1000+ posts) Send PM | Profile | Ignore Wed Feb-06-08 09:09 AM
Response to Reply #21
31. How can a form of organization that requires growth
mandate conservation of energy? It will eventually mean the death of that form of organization.

For government to have the ability to mandate anything, it needs more energy(people, money, oil, whatever), to make sure the rules are followed. Let alone all governments working together.
Printer Friendly | Permalink |  | Top
 
yop Donating Member (55 posts) Send PM | Profile | Ignore Sat Feb-09-08 06:15 AM
Response to Original message
43. Can someone explain
Can someone explain the economics here?

Demand is price-dependent- as the price goes up, people buy less. Shouldn't price increases bring the demand curve into line with the supply curve?
Printer Friendly | Permalink |  | Top
 
GliderGuider Donating Member (1000+ posts) Send PM | Profile | Ignore Sat Feb-09-08 08:58 AM
Response to Reply #43
44. Here's my explanation
Edited on Sat Feb-09-08 09:00 AM by GliderGuider
This isn't an economic scenario, so the use of the word "demand" is a bit misleading. Perhaps it would have been better if I used the phrase "desired consumption under business-as-usual assumptions".

What my curves show is that the likely evolution of known energy supplies is extremely unlikely to fulfill "desired consumption under business-as-usual assumptions" between now and 2050. That means that actual consumption will be lower than the curve I labeled "demand", since you can't consume what hasn't been produced.

However, the scenario assumes that rising consumption could be maintained if supply could be increased, implying that if supply is constrained there will be some amount of unfulfilled demand. And since demand does always meet supply at a price, the implication is that the price of energy (considered as a broad commodity class) is going to rise very steeply over the next few decades.

In this scenario I didn't address price, but an economic analysis taking into account the own-price elasticity of various forms of energy might be able to give us some idea of the magnitude of the price increase. For now I'd settle for "a lot", and if you put a gun to my head I might say I expect a twenty-fold increase in "energy" prices over the next 40 years - from an average increase in constant dollars of only 8% per year.
Printer Friendly | Permalink |  | Top
 
yop Donating Member (55 posts) Send PM | Profile | Ignore Tue Feb-12-08 07:01 AM
Response to Reply #44
46. Discontinuity
The overall energy supply curve forecasts a discontinuity- peak fossil energy occurring years before the "business as usual" expectation.

But the wind energy supply curve does not reflect this discontinuity- it's just a curve fit of pre-peak, "business as usual" data. It's not exactly a surprise that "business as usual" installation of wind capacity will not be able to make up for an unforeseen decrease in fossil energy supply.
Printer Friendly | Permalink |  | Top
 
GliderGuider Donating Member (1000+ posts) Send PM | Profile | Ignore Tue Feb-12-08 09:03 AM
Response to Reply #46
47. I have no data to support a major change in the rate of adoption of renewables
Edited on Tue Feb-12-08 09:11 AM by GliderGuider
The discontinuities I project in traditional energy supplies, particularly oil and gas, are based on analysis of the state of the in-ground resources, rates of discovery and exploitation, costs of production etc. The coming inflection in supply is clearly visible from the data, and I base my forecasts on that.

The supply curves for wind and solar have as yet no data showing an imminent "knee". People who incorporate such a feature are doing it based on hopes and expectations. If the curves change over the next three years (as they are doing in some places right now) I will change the analysis. It's entirely possible that the adoption curves will ramp up significantly in some places (USA, Europe, maybe China). However this scenario takes a global perspective, and a lot of the world is showing no sign of putting up large numbers of wind turbines - Africa, South Asia, Central and South America and the Middle East, for example.

The message of the analysis is that if we want wind (or some combination of wind, solar and other renewables) to plug the coming energy shortfall we will not get there by pursuing BAU. We're out of time, and current growth rates are nowhere near sufficient.
Printer Friendly | Permalink |  | Top
 
yop Donating Member (55 posts) Send PM | Profile | Ignore Tue Mar-04-08 05:41 AM
Response to Reply #47
49. "Hopes and expectations"
In other words, "economic analysis."

Just thought I'd dig this thread up in the wake of the recent GliderGuider vs kristopher debate.
Printer Friendly | Permalink |  | Top
 
losthills Donating Member (1000+ posts) Send PM | Profile | Ignore Sat Feb-09-08 10:03 AM
Response to Reply #43
45. A graph is an illustrated opinion.
Nothing more.
Printer Friendly | Permalink |  | Top
 
GliderGuider Donating Member (1000+ posts) Send PM | Profile | Ignore Tue Feb-12-08 09:07 AM
Response to Reply #45
48. I think informed opinions are often useful
Don't you?
Printer Friendly | Permalink |  | Top
 
DU AdBot (1000+ posts) Click to send private message to this author Click to view 
this author's profile Click to add 
this author to your buddy list Click to add 
this author to your Ignore list Fri Apr 26th 2024, 09:14 PM
Response to Original message
Advertisements [?]
 Top

Home » Discuss » Topic Forums » Environment/Energy Donate to DU

Powered by DCForum+ Version 1.1 Copyright 1997-2002 DCScripts.com
Software has been extensively modified by the DU administrators


Important Notices: By participating on this discussion board, visitors agree to abide by the rules outlined on our Rules page. Messages posted on the Democratic Underground Discussion Forums are the opinions of the individuals who post them, and do not necessarily represent the opinions of Democratic Underground, LLC.

Home  |  Discussion Forums  |  Journals |  Store  |  Donate

About DU  |  Contact Us  |  Privacy Policy

Got a message for Democratic Underground? Click here to send us a message.

© 2001 - 2011 Democratic Underground, LLC