September 4, 2008
Record ice loss in August
Sign up for the Arctic Sea Ice News RSS feed for automatic notification of analysis updates.
Following a record rate of ice loss through the month of August, Arctic sea ice extent already stands as the second-lowest on record, further reinforcing conclusions that the Arctic sea ice cover is in a long-term state of decline. With approximately two weeks left in the melt season, the possibility of setting a new record annual minimum in September remains open.
Overview of conditions
Arctic sea ice extent on September 3 was 4.85 million square kilometers (1.87 million square miles), a decline of 2.47 million square kilometers (950,000 square miles) since the beginning of August.
Extent is now within 370,000 square kilometers (140,000 square miles) of last years value on the same date and is 2.08 million square kilometers (800,000 square miles) below the 1979 to 2000 average.
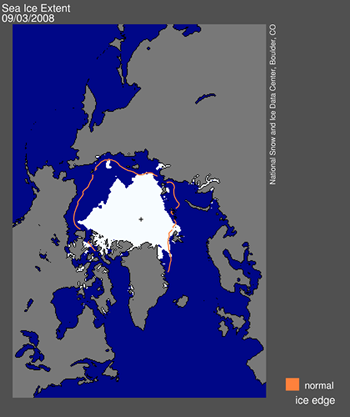
Figure 1. Daily Arctic sea ice extent for September 3, 2008, was 4.85 million square kilometers (1.87 million square miles). The orange line shows the 1979 to 2000 average extent for that day. The black cross indicates the geographic North Pole.
Figure 1. Daily Arctic sea ice extent for September 3, 2008, was 4.85 million square kilometers (1.87 million square miles). The orange line shows the 1979 to 2000 average extent for that day. The black cross indicates the geographic North Pole.
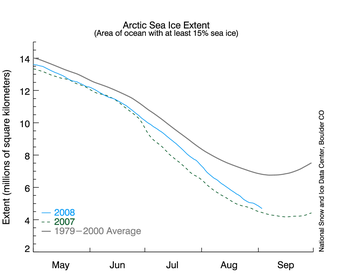
2. The graph above shows daily sea ice extent.The solid light blue line indicates 2008; the dashed green line shows extent for 2007; the gray line indicates average extent from 1979 to 2000.
Regional ice loss contributes to decline
What part of the Arctic contributed most strongly to the rapid August decline? Through spring and early summer, ice losses were largest in the Beaufort Sea. In August, the pattern of ice loss changed, with the greatest ice losses shifting to the Chukchi and East Siberian Seas.
The shift in location of maximum ice losses was fueled by a shift in atmospheric circulation. A pattern of high pressure set up over the Chukchi Sea, bringing warm southerly air into the region and pushing ice away from shore. August air temperatures in the Chukchi Sea (at 925 millibars pressure, roughly 750 meters <2,500 feet> in altitude) were 5 to 7 degrees Celsius (9 to 13 degrees Fahrenheit) warmer than normal. Ice loss in the Chukchi and East Siberian Seas averaged 14,000 square kilometers (5,400 square miles) per day faster than in 2007.
Sea ice also experienced an unusual retreat north of Ellesmere Island during August. Partial collapse of ice shelves in the region attended this retreat. Visit the Trent University press release at:
http://www.trentu.ca/newsevents/newsreleases_080903iceshelf.php.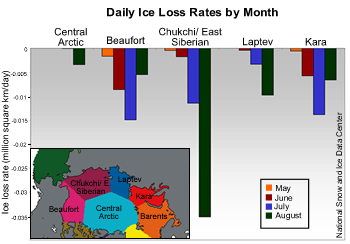
Figure 3. The pattern of ice loss changed sharply in August, with the greatest ice losses shifting from the Beaufort to the the Chukchi and East Siberian Seas.
Warm ocean temperatures
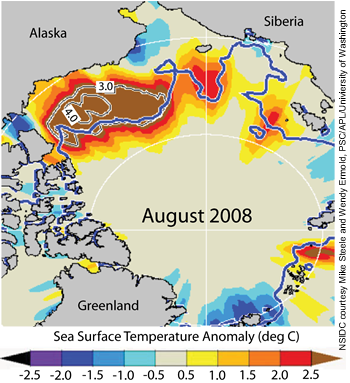
Mike Steele and Wendy Ermold from the University of Washingtons Applied Physics Laboratory Polar Science Center have been closely monitoring sea surface temperatures in the Arctic.
Positive sea surface temperature anomalies for August 2008 correspond with areas of ice retreat. When the ice melts, it exposes open water that absorbs solar energy; the warm ocean waters then favor further sea ice melt. An interesting phenomenon, in this regard, is that sea ice this August has been drifting into the Beaufort Sea only to melt when it encounters these warm ocean waters.
As autumn comes to the Arctic, the ocean will begin to lose its heat back to the atmosphere. This means that regions of high sea surface temperatures seen in August will be manifested as above-average air temperature in corresponding regions as autumn unfolds.
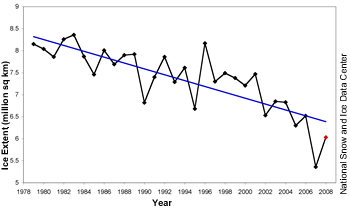
5. Monthly August ice extent for 1979 to 2008 shows 2008 as the second-lowest August on record.
Arctic sea ice extent averaged over the month of August was 5.36 million square kilometers (2.07 million square miles). This is 1.64 million square kilometers (633,000 square miles) below the 1979 to 2000 August average,
However, August 2008 was still 67,000 square kilometers (26,000 square miles) above August 2007, despite the record-breaking rate of decline over the past month. Why would this be? The best explanation for this is that this summer did not experience the "perfect storm" of atmospheric conditions seen throughout the summer of 2007.
Even though August ice extent was above that of August 2007, the downward trend for August ice loss has now gone from -8.4% per decade to -8.7% per decade.
EDIT/END
http://nsidc.org/arcticseaicenews/index.html