Mods: Press Release.
September 8, 2009
Winds cause sea ice to spread in August
Atmospheric circulation patterns in August helped spread out sea ice, slowing ice loss in most regions of the Arctic. NSIDC scientists expect to see the minimum ice extent for the year in the next few weeks. While this year's minimum ice extent will probably not reach the record low of 2007, it remains well below normal: average ice extent for August 2009 was the third-lowest in the satellite record. Ice extent has now fallen below the 2005 minimum, previously the third-lowest extent in the satellite record.
Overview of conditions
Sea ice extent averaged over the month of August 2009 was 6.26 million square kilometers (2.42 million square miles). This is 900,000 square kilometers (350,000 square miles) above the record low for the month, which occurred in August 2007, 200,000 square kilometers (77,000 square miles) above August 2008, and just below the August 2005 value of 6.30 million square kilometers (2.43 million square miles). Arctic sea ice extent for August 2009 was 1.41 million square kilometers (540,000 square miles) below the 1979 to 2000 average.
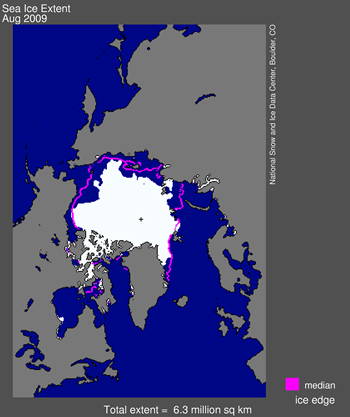
Figure 1. Arctic sea ice extent for August 2009 was 6.26 million square kilometers (2.42 million square miles). The magenta line shows the 1979 to 2000 median extent for that month. The black cross indicates the geographic North Pole. Sea Ice Index data. About the data.
Credit: National Snow and Ice Data Center
Conditions in context
In the beginning of August, the rate of ice loss was fairly slow. In the middle of the month, the loss rate sped up, and then slowed again. On average, the decline rate was close to the 1978 to 2000 average for past Augusts. Ice extent declined by 55,000 square kilometers (21,000 square miles) per day during August, compared to 66,000 square kilometers (25,000 square miles) per day in August 2007 and 79,000 square kilometers (31,000 square miles) per day in August 2008. But because of the higher-than-average rate of ice loss in July, average ice extent for August 2009 was still far below the 1978 to 2000 average extent for the month.
On September 2, Arctic sea ice extent dropped below the minimum extent for 2005. This year is now the third-lowest ice extent in the satellite record, with one to two weeks left in the melt season.
The minimum ice extent for the year will probably occur in the next two weeks. NSIDC scientists are closely monitoring conditions and will report the minimum when it occurs.
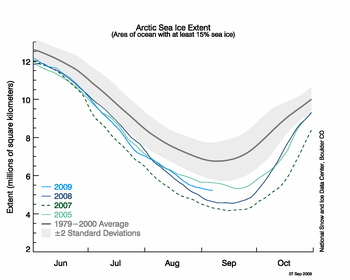
Figure 2. The graph above shows daily sea ice extent as of September 7, 2009. The solid light blue line indicates 2009; dark blue shows 2008, dashed green indicates 2007; light green shows 2005, and solid gray indicates average extent from 1979 to 2000. The gray area around the average line shows the two standard deviation range of the data. Sea Ice Index data.
Credit: National Snow and Ice Data Center
August 2009 compared to past years
Arctic sea ice extent for August 2009 was the third lowest August since 1978, continuing the downward trend observed over the last three decades. Only 2007 and 2008 had lower ice extent during August. The long-term trend indicates a decline of 8.7% per decade in August ice extent since 1979.
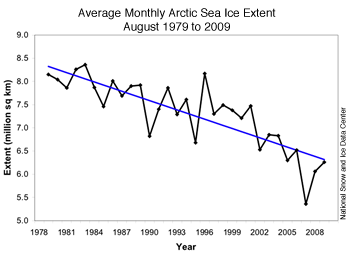
Figure 3. Monthly August ice extent for 1979 to 2009 shows a decline of 8.7% per decade.
High ice loss in the Beaufort Sea and Siberian Arctic
This August, the Beaufort Sea lost more ice than in either 2007 or 2008. In other regions of the Arctic, ice loss rates were about the same as in August 2007, except in the central Arctic, where more ice was lost in 2007. These year-to-year differences in regional ice loss rates reflect variations in surface wind and temperature patterns that affect the ice motion and melt.
Overall, ice loss rates this year were slower than than in August 2008, when ice declined at record rates. But because the July 2008 rate of decline was slower, the minimum ice extent in September 2008 did not reach the 2007 record low.
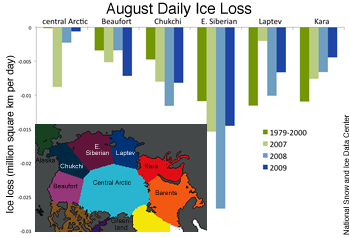
Figure 4. Regional ice loss rates in August of this year were similar to August 2007, but slower than August 2008. Year-to-year variations in the ice loss rates show the impact of wind and temperature patterns on regional ice loss.
EDIT
http://nsidc.org/arcticseaicenews/index.html