Mods - press release.
Arctic sea ice extent for February 2011 tied with February 2005 as the lowest recorded in the satellite record. Sea ice extent was particularly low in the Labrador Sea and Gulf of St. Lawrence. In contrast, winter snow cover remained extensive in many parts of the Northern Hemisphere.
Overview of conditions
Sea ice extent averaged over the month of February 2011 was 14.36 million square kilometers (5.54 million square miles). This was a tie with the previous record low for the month, set in 2005. February ice extent remained below normal in both the Atlantic and Pacific sectors, particularly in the Labrador Sea and the Gulf of St. Lawrence.
While ice extent has declined less in winter months than in summer, the downward winter trend is clear. The 1979 to 2000 average is 15.64 million square kilometers (6.04 million square miles). From 1979 through 2003, the February extent averaged 15.60 million square kilometers (6.02 million square miles). Every year since 2004 has had a mean February extent below 15 million square kilometers (5.79 million square miles).
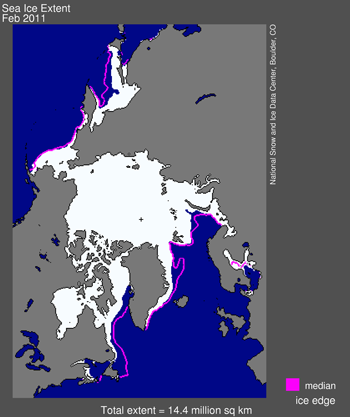
Figure 1. Arctic sea ice extent for February 2011 was 14.36 million square kilometers (5.54 million square miles). The magenta line shows the 1979 to 2000 median extent for that month. The black cross indicates the geographic North Pole.
Conditions in context
While ice extent grew at average rates for February, the overall extent remained anomalously low. Air temperatures over most of the Arctic Ocean were between 2 and 4 degrees Celsius (4 and 7 degrees Fahrenheit) higher than normal. Over the East Greenland Sea and north towards the Pole, air temperatures were 5 to 7 degrees Celsius (9 to 13 degrees Fahrenheit) higher than normal. Colder conditions, 2 to 6 degrees Celsius (4 to 11 degrees Fahrenheit) below average persisted over western Eurasia, east-central Eurasia and some of the Canadian Arctic.
As air temperatures dropped in the eastern Canadian Arctic in February, parts of the Labrador Sea started to freeze over. However, the Gulf of St. Lawrence remained mostly free of ice. As during winter 2010, when Environment Canada reported that sea ice in the Gulf of St. Lawrence was at the lowest level on record, the lack of ice will make it difficult for harp seals to give birth to their pups on the sea ice, as they normally do in February and March.
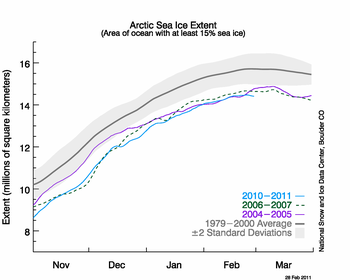
Figure 2. The graph above shows daily Arctic sea ice extent as of February 28, 2011, along with daily ice extents for previous low-ice-extent years in the month of February. Light blue indicates 2011, green shows 2007, purple shows 2005 (the record low for the month was in 2005), and dark gray shows the 1979 to 2000 average. The gray area around the average line shows the two standard deviation range of the data.
February 2011 compared to past years
February 2011 tied February 2005 for the lowest ice extent for the month in the satellite record. Including 2011, the February trend is now at -3.0 percent per decade.
Through most of January, the Arctic Oscillation (AO) was generally in a strongly negative phase, similar to the pattern that dominated the winter of 2009 to 2010. This led to very warm temperatures over the eastern Arctic, helping to account for the low ice extents over the Labrador Sea and Gulf of Saint Lawrence. However, toward the end of January, the AO returned to a positive phase, and ice began to grow in the Labrador Sea and Gulf of St. Lawrence. For more information on current AO conditions, visit the NOAA Climate Prediction Center Web page.
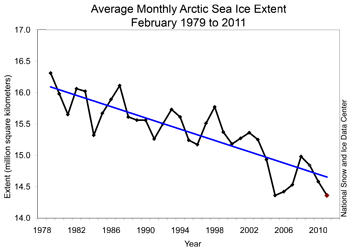
Figure 3. Monthly February ice extent for 1979 to 2011 shows a decline of 3.0% per decade.
EDIT
http://nsidc.org/arcticseaicenews/index.html