New images show just how much US temperatures in July and January have changed recently as the nation feels the impact of global climate change. Dubbed the 'new normals' of US climate, the maps focus on July maximums typically the hottest month of the year and January minimums typically the coldest month. While both July highs and January lows warmed recently, January lows saw the biggest jump.
By contrasting temperatures from 1971-2000 and 1981-2010, the maps show significant rises in temperatures in many parts of the country. While July maximums saw some cooling in the Midwest (up to 1.5 degree Fahrenheit), the temperatures rose elsewhere, including up to 3 degrees Fahrenheit in parts of the West and Pacific Northwest.
January minimums rose even more starkly. Except for Florida and parts of the Southeast, January minimums rose everywhere else, especially in the Midwest and Rocky Mountains, where between 1971-2000 and 1981-2010 minimums jumped up to 4 degrees Fahrenheit.
All fifty states saw average temperatures rise between 1971-2000 and 1981-2010.
EDIT
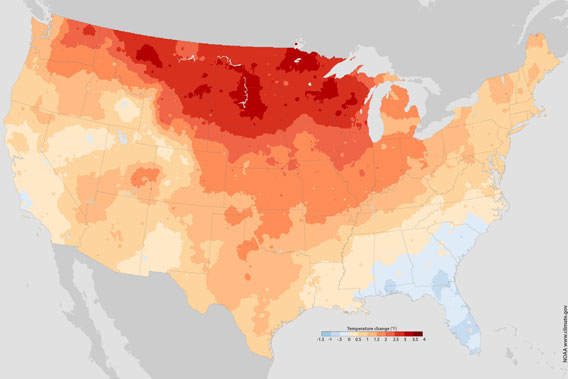
January minimum temperature comparison from two 30 year measurements: 1971-2000 and 1981-2010. Map courtesy of NASA.
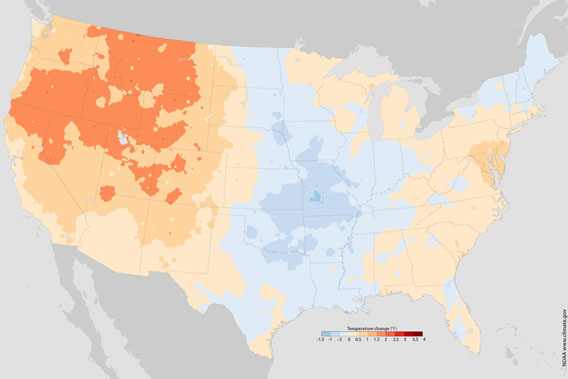
July maximum temperature comparison from two 30 year measurements: 1971-2000 and 1981-2010. Map courtesy of NASA.
http://news.mongabay.com/2011/0713-hance_climate_us.html