DavidDvorkin
 (1000+ posts)
Send PM |
Profile |
Ignore
(1000+ posts)
Send PM |
Profile |
Ignore
|
Wed Feb-27-08 10:58 AM
Original message |
| Rasmussen daily graph for 2/27/08 - Obama up 1 (47), Clinton unchanged (43) |
|
Obamasurge(let)! These graphs are all contained on one Web page at http://www.dvorkin.com/rastrack.htmlGallup now has a daily tracking poll graph: http://www.gallup.com/poll/104563/Gallup-Daily-Tracking-Election-2008.aspx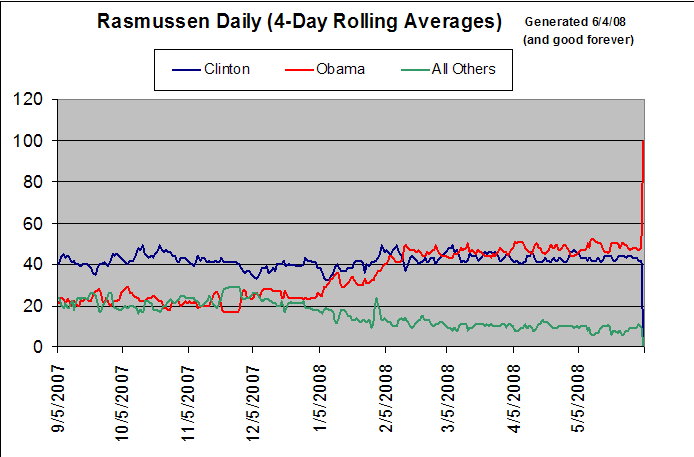   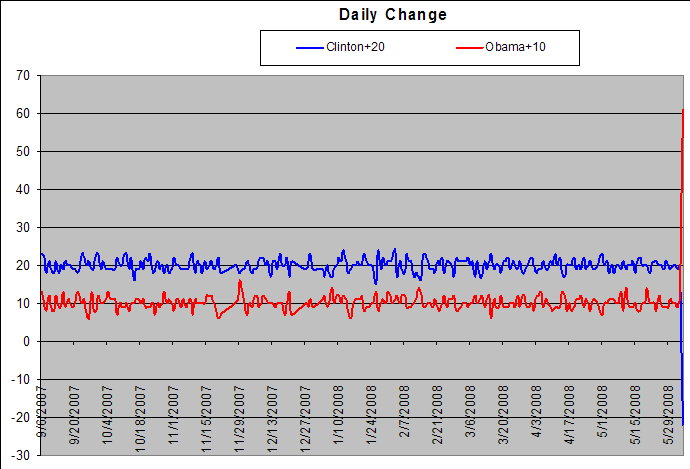 (Pretend that the 10 and 20 lines are actually 0. Does anyone know how to make Excel label different parts of the axis differently?) Rasmussen links: Data in tabular form Discussion |
| Recursion
(1000+ posts)
Send PM |
Profile |
Ignore
|
Wed Feb-27-08 11:01 AM
Response to Original message |
| 1. Easiest way is to make two charts |
|
There's nothing like Matlab's or GNUPlot's subplot() that I've ever found.
|
| DavidDvorkin
(1000+ posts)
Send PM |
Profile |
Ignore
|
Wed Feb-27-08 11:22 AM
Response to Reply #1 |
| 2. I guess that's what I'll have to do |
|
I was trying to avoid doing that. Another graph to maintain!
|
| Recursion
(1000+ posts)
Send PM |
Profile |
Ignore
|
Wed Feb-27-08 11:27 AM
Response to Reply #2 |
| 3. I'd be interested in a gain analysis, though that would take different data |
|
I'd love to see some metric that could at least more or less measure the absolute number of supporters of each, and do a decibel gain analysis of different events in the campaign.
|
| DavidDvorkin
(1000+ posts)
Send PM |
Profile |
Ignore
|
Wed Feb-27-08 02:54 PM
Response to Original message |
| DavidDvorkin
(1000+ posts)
Send PM |
Profile |
Ignore
|
Wed Feb-27-08 04:12 PM
Response to Original message |
| DavidDvorkin
(1000+ posts)
Send PM |
Profile |
Ignore
|
Wed Feb-27-08 08:07 PM
Response to Original message |
DU
AdBot (1000+ posts)     |
Thu Apr 25th 2024, 12:20 AM
Response to Original message |