Democratic Underground Latest Greatest Lobby Journals Search Options Help Login
Google

Next time someone says that you can't raise taxes in a bad economy

Printer-friendly format Printer-friendly format
Printer-friendly format Email this thread to a friend
Printer-friendly format Bookmark this thread
This topic is archived.
Home » Discuss » Archives » General Discussion (1/22-2007 thru 12/14/2010) Donate to DU
 
JamesA1102 Donating Member (1000+ posts) Send PM | Profile | Ignore Mon Sep-06-10 09:57 PM
Original message
Next time someone says that you can't raise taxes in a bad economy
show them this chart:

Printer Friendly | Permalink |  | Top
xchrom Donating Member (1000+ posts) Send PM | Profile | Ignore Mon Sep-06-10 10:03 PM
Response to Original message
1. Recommend - printing it out and leaving under windshield wipers
In the grocery parking lot.
Printer Friendly | Permalink |  | Top
 
one_voice Donating Member (1000+ posts) Send PM | Profile | Ignore Mon Sep-06-10 10:05 PM
Response to Reply #1
2. Good idea. n/t
Printer Friendly | Permalink |  | Top
 
handmade34 Donating Member (1000+ posts) Send PM | Profile | Ignore Mon Sep-06-10 10:29 PM
Response to Reply #1
3. suggest further explanation on printout
many may not understand just the visual... ??!! many people don't understand how money works
Printer Friendly | Permalink |  | Top
 
Beartracks Donating Member (1000+ posts) Send PM | Profile | Ignore Mon Sep-06-10 11:33 PM
Response to Reply #3
6. Yes, can someone provide a concise explanation?
I sure would like to forward this around.

------------------------------
Printer Friendly | Permalink |  | Top
 
JamesA1102 Donating Member (1000+ posts) Send PM | Profile | Ignore Tue Sep-07-10 07:05 AM
Response to Reply #6
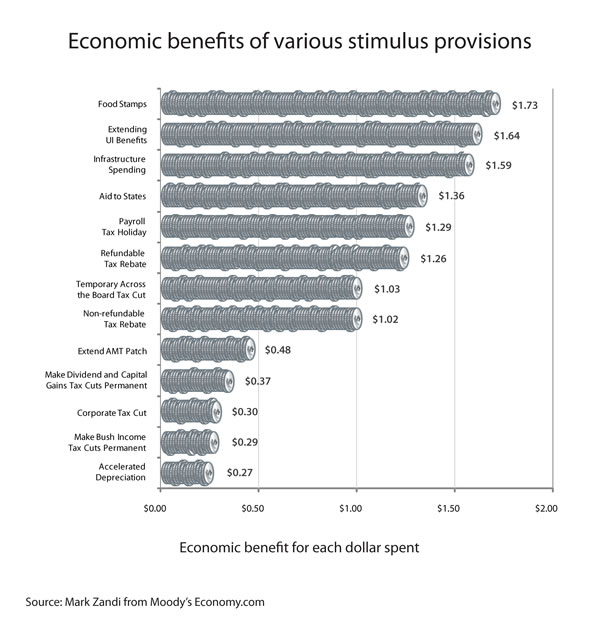
7. It shows how well each government effort stimulates the economy
So for each dollar the government spends on it generates $1.73 in economic activity. Extending the Bush tax cuts generates only $0.29 and thus would have negative effect.
Printer Friendly | Permalink |  | Top
 
slackmaster Donating Member (1000+ posts) Send PM | Profile | Ignore Wed Sep-08-10 03:42 PM
Response to Reply #7
12. Do you have a link to something to back it up, in case someone wants to check the source?
Edited on Wed Sep-08-10 03:48 PM by slackmaster
I have no way to tell who came up with those figures, or how. It looks like a great deal of extra explanation is needed. There must be some constraints under which those figures hold true.
Printer Friendly | Permalink |  | Top
 
EOTE Donating Member (1000+ posts) Send PM | Profile | Ignore Thu Sep-09-10 10:48 AM
Response to Reply #12
24. Here's but one.
Printer Friendly | Permalink |  | Top
 
slackmaster Donating Member (1000+ posts) Send PM | Profile | Ignore Thu Sep-09-10 12:12 PM
Response to Reply #24
28. Thanks, but that provides absolutely no information about how the chart in the OP was derived
:hi:
Printer Friendly | Permalink |  | Top
 
EOTE Donating Member (1000+ posts) Send PM | Profile | Ignore Thu Sep-09-10 12:21 PM
Response to Reply #28
30. No, that's not true at all.
If you had bothered to read any of the pertinent information, you'd see it was based upon simulations using Moody's macroeconomic model. Who is Moody's?
http://www.economy.com/home/about/about.asp

So initially your argument is that the chart is meaningless and doesn't provide any context. NOW your argument is that you don't believe the data that's provided. You really need to make up your mind.
Printer Friendly | Permalink |  | Top
 
slackmaster Donating Member (1000+ posts) Send PM | Profile | Ignore Thu Sep-09-10 12:23 PM
Response to Reply #30
31. I just want to know how the information in the chart in the OP was compiled
Edited on Thu Sep-09-10 12:24 PM by slackmaster
It's a very simple question, to which apparently you have no answer.

If you don't know, please just say so.
Printer Friendly | Permalink |  | Top
 
EOTE Donating Member (1000+ posts) Send PM | Profile | Ignore Thu Sep-09-10 12:24 PM
Response to Reply #31
32. And I've provided that information more than once.
Even simpler.
Printer Friendly | Permalink |  | Top
 
slackmaster Donating Member (1000+ posts) Send PM | Profile | Ignore Thu Sep-09-10 12:29 PM
Response to Reply #32
33. I can find bits and pieces, e.g. the $1.73 attributed to food stamps, which helps a little
But not how the entire chart was compiled.
Printer Friendly | Permalink |  | Top
 
EOTE Donating Member (1000+ posts) Send PM | Profile | Ignore Thu Sep-09-10 12:38 PM
Response to Reply #33
35. Do you need me to do ALL of the work for you?
Once again, the data is provided by simulations run on Moody's macroeconomic model. If you had bothered to read the footnote, you'd find this: "The model is a large-scale econometric model of the U.S. economy. A detailed description of the model
is available upon request."

Now, you're welcome to request that detailed description of the model, but it wouldn't mean anything to you (it would mean very little to me as well.) If you have any information pointing toward Moody's cooking the books, you're more than welcome to provide it.
Printer Friendly | Permalink |  | Top
 
OHdem10 Donating Member (1000+ posts) Send PM | Profile | Ignore Mon Sep-06-10 10:32 PM
Response to Original message
4. Bill Clinton inherited a recession. His very first budget , he raised
taxes--we came out the recession and on the way to
prosperity.

NOT ONE Republican voted for his budget bill which started
us on pathway to a surplus.
Printer Friendly | Permalink |  | Top
 
doc03 Donating Member (1000+ posts) Send PM | Profile | Ignore Mon Sep-06-10 11:17 PM
Response to Original message
5. Have no idea what that chart is supposed to explain n/t
Edited on Mon Sep-06-10 11:18 PM by doc03
Printer Friendly | Permalink |  | Top
 
ThomWV Donating Member (1000+ posts) Send PM | Profile | Ignore Tue Sep-07-10 07:16 AM
Response to Reply #5
8. Pathetic, isn't it? I know what it shows just because I recognize the numbers
but without that foreknowledge I'd have no idea on earth what the chart is suppose to show.
Printer Friendly | Permalink |  | Top
 
sl8 Donating Member (256 posts) Send PM | Profile | Ignore Tue Sep-07-10 07:32 AM
Response to Reply #5
9. Link to article:
Mother Jones, "Stimulus Is for Suckers"
http://motherjones.com/politics/2008/12/stimulus-suckers
Printer Friendly | Permalink |  | Top
 
JamesA1102 Donating Member (1000+ posts) Send PM | Profile | Ignore Wed Sep-08-10 03:39 PM
Response to Original message
10. Here's a better chart
Printer Friendly | Permalink |  | Top
 
slackmaster Donating Member (1000+ posts) Send PM | Profile | Ignore Wed Sep-08-10 03:43 PM
Response to Reply #10
14. So, if government spent 100 trillion dollars on food stamps, we'd get 173 trillion back?
I'm still not getting it.
Printer Friendly | Permalink |  | Top
 
EOTE Donating Member (1000+ posts) Send PM | Profile | Ignore Wed Sep-08-10 03:51 PM
Response to Reply #14
15. No chart like that is completely linear.
The law of diminishing returns certainly applies in this area. But yes, CURRENTLY, due to the multiplier effect, $1 invested in food stamps will create $1.73 in additional spending. But as demand for food stamps is elastic, that number will change as supply increases.
Printer Friendly | Permalink |  | Top
 
slackmaster Donating Member (1000+ posts) Send PM | Profile | Ignore Wed Sep-08-10 03:53 PM
Response to Reply #15
16. Spending $1 on food stamps wouldn't even pay for a single Happy Meal
Edited on Wed Sep-08-10 03:55 PM by slackmaster
I want to see more information about the chart. Without some explanation of the constraints under which those figures would hold true, it really doesn't say anything useful.
Printer Friendly | Permalink |  | Top
 
EOTE Donating Member (1000+ posts) Send PM | Profile | Ignore Wed Sep-08-10 04:10 PM
Response to Reply #16
17. I don't think you understand how government spending and the multiplier effect works.
You need to know what a person's marginal utility of the dollar is before you can see what type of spending providing that person with money will provide. Let's say you have two different people:

Person A makes a high seven figure salary and has just about all the toys and gizmos he could want.

Person B makes a low five figure salary and is struggling to pay his mortgage while still providing things like food and a modicum of entertainment.

Let's say that the government gives person A an additional dollar. Given that this person already has pretty much everything he needs and has extremely little incentive to spend more than he had already planned on, he puts the money directly into savings. Additional spending provided? $0.00

Now let's say that the government gives person B an additional dollar. Given that this person is already struggling to get by, he puts that money toward buying a cheeseburger at McD's. So, that's an additional dollar going to McDonald's as well. A large chunk of that buck goes to the wealthy owners of McDonald's, but that money also goes to a number of employees at McDonald's who, also having a high marginal utility of the dollar, are likely to spend that money further stimulating the economy.

That chart above just goes to show how supply side economics (Reaganomics, Voodoo economics) is absolute bullshit. If you take care of the demand side, your money goes much, much, MUCH further. In fact, you could say that money provided to the supply side, especially during times like these, actually has negative value. Where as money toward the demand side has a number of benefits.
Printer Friendly | Permalink |  | Top
 
slackmaster Donating Member (1000+ posts) Send PM | Profile | Ignore Wed Sep-08-10 05:51 PM
Response to Reply #17
19. It doesn't seem to have enough information to make any specific policy decisions
I'm just looking for an explanation of its significance in the real world, not broad generalities.
Printer Friendly | Permalink |  | Top
 
EOTE Donating Member (1000+ posts) Send PM | Profile | Ignore Thu Sep-09-10 07:17 AM
Response to Reply #19
20. If you don't know how consumer spending stimulates the economy...
then I don't know if this issue can be explained to you any further. If you want to stimulate the economy, you give money to the people with the highest marginal utility of the dollar, that's economics 101. That chart shows that can be far better accomplished by funding food stamps rather than corporate tax giveaways. There's no broad generalities here. It's very simple.
Printer Friendly | Permalink |  | Top
 
slackmaster Donating Member (1000+ posts) Send PM | Profile | Ignore Thu Sep-09-10 10:33 AM
Response to Reply #20
21. Maybe we should stop patching the Alternative Minimum Tax altogether, forever
Edited on Thu Sep-09-10 10:33 AM by slackmaster
The economy will be REALLY stimulated when inflation pushes the entire middle class into the range where they are at risk of AMT.
Printer Friendly | Permalink |  | Top
 
EOTE Donating Member (1000+ posts) Send PM | Profile | Ignore Thu Sep-09-10 10:43 AM
Response to Reply #21
22. Whaaaaat? What on earth does any of this have to do with the AMT?
Without "patching" the AMT, yes, the middle class would eventually be forced to pay it. Eventually, almost everyone would. What on earth is your point? Are you suggesting the AMT be eliminated? I honestly have no idea where you're trying to go with this argument.

This OP is about which federal dollars have what effect on the economy. Federal dollars put toward demand have a far greater positive impact on the economy than money put toward supply. What about that is hard to understand?
Printer Friendly | Permalink |  | Top
 
slackmaster Donating Member (1000+ posts) Send PM | Profile | Ignore Thu Sep-09-10 10:46 AM
Response to Reply #22
23. My point is that the chart is useless as a policy-driver without additional data
Edited on Thu Sep-09-10 10:51 AM by slackmaster
This OP is about which federal dollars have what effect on the economy. Federal dollars put toward demand have a far greater positive impact on the economy than money put toward supply.

Those positive effects are obviously limited. There are surely boundaries beyond which returns on things like food stamps drop precipitously. It would make no sense to spend trillions of dollars on food stamps.

I want to see that information. Without it, I find the chart almost without meaning. It ends up being a feel-good post for those who oppose supply-side economics in general; which is fine with me, but it's a dimensionless, shallow view of the economy IMO.

Are you suggesting the AMT be eliminated?

No, I think there should be a permanent fix for the AMT - Specifically, index it to inflation as should have been done when the AMT was created. Much time gets wasted patching it, and when Congress is slow to act it becomes a sword of Damocles over the heads of an ever-increasing number of people. (I almost got hit with it myself, even though I am far from wealthy. It had to do with an exercise of stock options that were going to expire.)
Printer Friendly | Permalink |  | Top
 
EOTE Donating Member (1000+ posts) Send PM | Profile | Ignore Thu Sep-09-10 10:59 AM
Response to Reply #23
25. You are asking for information which could not possibly be provided.
In order to demonstrate the law of diminishing returns, we'd have to have pushed those numbers to the point where they're no longer applicable. Government response to recessions has included money toward UI and food stamps. THAT is where this data comes from. That means that we've never seen those boundaries.

If government investment into consumer spending has a negative ROI, it's insanely unlikely that this ROI will become positive with increased spending over time.

If you see that chart as meaningless, it speaks to your inability to comprehend the information.
Printer Friendly | Permalink |  | Top
 
slackmaster Donating Member (1000+ posts) Send PM | Profile | Ignore Thu Sep-09-10 12:10 PM
Response to Reply #25
27. Gee, let's make it personal
Edited on Thu Sep-09-10 12:19 PM by slackmaster
How about a link to an explanation of how the figures on the chart were derived?

If you see that chart as meaningless, it speaks to your inability to comprehend the information.

How am I supposed to "comprehend" the chart when nobody has provided any links to explain how the numbers were derived? Sources listed include "Congressional testimony", and we all know how reliable and accurate that is. For all I know, everything on the chart was pulled from thin air.

I have a lot of abilities. I admit econ is not my strongest subject, but I'm not stupid, and I don't appreciate you making such a snide remark.
Printer Friendly | Permalink |  | Top
 
EOTE Donating Member (1000+ posts) Send PM | Profile | Ignore Thu Sep-09-10 12:40 PM
Response to Reply #27
36. That's not what you wanted originally.
You said that the number provided no context in and of themselves. That, is bullshit. Now you're claiming that the issue you had with the chart is unsourced. Well, I provided you the source of this information, but you don't seem to care much.
Printer Friendly | Permalink |  | Top
 
EOTE Donating Member (1000+ posts) Send PM | Profile | Ignore Thu Sep-09-10 11:05 AM
Response to Reply #23
26. And once again, this has nothing to do with the AMT.
I agree it should have been indexed to inflation from the beginning (with perhaps some exceptions). And yes, it creates an unnecessary burden on congress. But it has absolutely nothing to do with the effectiveness of stimulus dollars.
Printer Friendly | Permalink |  | Top
 
slackmaster Donating Member (1000+ posts) Send PM | Profile | Ignore Thu Sep-09-10 12:18 PM
Response to Reply #26
29. AMT fix is listed on the chart in the OP as having "negative returns"
I don't understand what that means, but I know that AMT fixes are essential until a permanent fix is established.

But it has absolutely nothing to do with the effectiveness of stimulus dollars.

Perhaps you can explain why it appears on the chart in the OP, which I was under the impression had something to do with the effectiveness of stimulus dollars.
Printer Friendly | Permalink |  | Top
 
EOTE Donating Member (1000+ posts) Send PM | Profile | Ignore Thu Sep-09-10 12:34 PM
Response to Reply #29
34. It provides negative returns because the increase in spending it would provide
is eclipsed by the amount of taxes lost to it.

And perhaps it was hasty to suggest that patching the AMT has nothing to do with stimulus funds as it has been floated about as one of the recipients of stimulus bucks. But in that context, anything the government spends any money on pertains to the stimulus. It's showing which recipients of those dollars provide the most bang for the buck.
Printer Friendly | Permalink |  | Top
 
slackmaster Donating Member (1000+ posts) Send PM | Profile | Ignore Wed Sep-08-10 03:41 PM
Response to Original message
11. Late virtual Unrec for posting a graph without a proper legend
What is it supposed to mean?
Printer Friendly | Permalink |  | Top
 
kentuck Donating Member (1000+ posts) Send PM | Profile | Ignore Wed Sep-08-10 03:43 PM
Response to Original message
13. Great chart !
Thanks
Printer Friendly | Permalink |  | Top
 
librechik Donating Member (1000+ posts) Send PM | Profile | Ignore Wed Sep-08-10 04:11 PM
Response to Original message
18. yeah, you're also not supposed to CUT taxes during a WAR
but what do they care. They're not trying to do the right thing. They're trying to please their corporate masters.
Printer Friendly | Permalink |  | Top
 
DU AdBot (1000+ posts) Click to send private message to this author Click to view 
this author's profile Click to add 
this author to your buddy list Click to add 
this author to your Ignore list Fri Apr 26th 2024, 03:27 AM
Response to Original message
Advertisements [?]
 Top

Home » Discuss » Archives » General Discussion (1/22-2007 thru 12/14/2010) Donate to DU

Powered by DCForum+ Version 1.1 Copyright 1997-2002 DCScripts.com
Software has been extensively modified by the DU administrators


Important Notices: By participating on this discussion board, visitors agree to abide by the rules outlined on our Rules page. Messages posted on the Democratic Underground Discussion Forums are the opinions of the individuals who post them, and do not necessarily represent the opinions of Democratic Underground, LLC.

Home  |  Discussion Forums  |  Journals |  Store  |  Donate

About DU  |  Contact Us  |  Privacy Policy

Got a message for Democratic Underground? Click here to send us a message.

© 2001 - 2011 Democratic Underground, LLC