ProSense
 (1000+ posts)
Send PM |
Profile |
Ignore
(1000+ posts)
Send PM |
Profile |
Ignore
|
Thu Feb-04-10 06:13 PM
Original message |
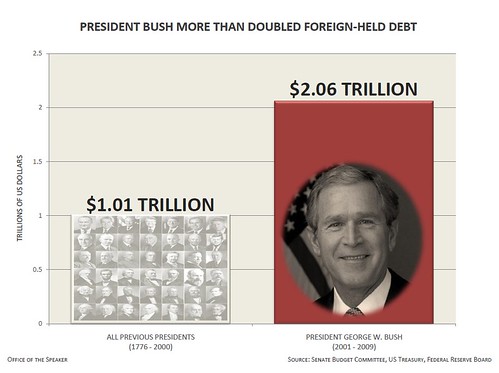
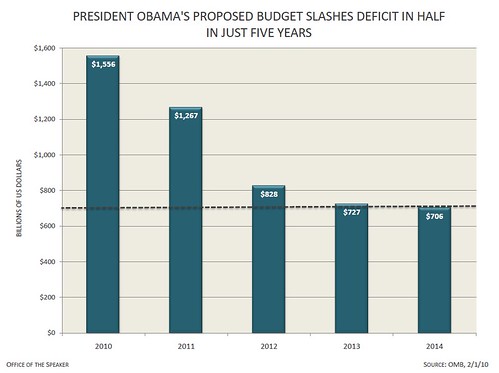
| Who Left Us With Huge Deficits? |
| indepat
(1000+ posts)
Send PM |
Profile |
Ignore
|
Thu Feb-04-10 06:27 PM
Response to Original message |
| 1. $16.2 trillion is what the graph depicts as the Gipper's, WHWB's and junior combined debt: |
|
have long proffered junior is the worst president ever, followed by the gipper and GHWB. That a strong correlation exists between debt and putrid maladministrations is a no-brainer. :P
|
| theoldman
(1000+ posts)
Send PM |
Profile |
Ignore
|
Thu Feb-04-10 06:35 PM
Response to Reply #1 |
| 4. GHWB had the same problem Obama has. |
|
GHWB could not stop the bleeding resulting from Reagan's spending so the Republicans turned against him.
|
| indepat
(1000+ posts)
Send PM |
Profile |
Ignore
|
Fri Feb-05-10 11:47 AM
Response to Reply #4 |
| 12. GHWB was stuck with the gipper's irresponsible and unfair tax scheme, that is why the gipper was |
|
more culpable, but in no way was GHWB going to undo the gipper's handi-work. BHO inherited junior's wretched tax scheme, junior's two wars, and junior's waylaying of the economy, so BHO should not be blamed for what junior left him that cannot be readily corrected. 'course BHO has continued junior's two wars and junior's tax schemes thus far. :P
|
| liberal N proud
(1000+ posts)
Send PM |
Profile |
Ignore
|
Thu Feb-04-10 06:27 PM
Response to Original message |
| 2. And the GOP continues to play their broken fiscally conservative record |
|
They can only find this record when the Democrats are in power.
Why does the public not see this? All we hear now is that the Democrats are breaking America. :nuke:
|
| theoldman
(1000+ posts)
Send PM |
Profile |
Ignore
|
Thu Feb-04-10 06:31 PM
Response to Original message |
| 3. I always thought that deficits added to the total debt. |
|
In other words the deficit is the amount the government over-spends each year. Debt is what accumulates over a period of many years.
|
| timeforpeace
(1000+ posts)
Send PM |
Profile |
Ignore
|
Thu Feb-04-10 06:38 PM
Response to Original message |
| 5. Lowering taxes leads to deficits? Who knew? |
| 4lbs
(1000+ posts)
Send PM |
Profile |
Ignore
|
Thu Feb-04-10 06:50 PM
Response to Reply #5 |
| 8. Lowering taxes without cutting spending to match is what causes deficits. |
|
The Repukes cut taxes for the rich, but continued to spend hundreds of billions per year on Iraq. They masked those hundreds of billions with supplementals so it looked like they had balanced the budget during the 2000's, when they actually were running a ~150 billion dollar deficit annually.
President Obama is wisely cutting taxes for the middle class and small businesses, while offsetting those tax cuts with the ending of corporate subsidy programs to the banks, oil, and health/drug industries.
|
| MindandSoul
(1000+ posts)
Send PM |
Profile |
Ignore
|
Thu Feb-04-10 06:41 PM
Response to Original message |
| 6. Thank you! Here is another set of data that goes even further back and confirms yours! |
|
Please read this:
Aggregate data from 1960 and 1980 to present (5-05)
1) Deficit (On Budget)
1961-present
Total Democratic Budget Deficits: $1283.8 billion
Total Republican Budget Deficits: $5487.4 billion
Democratic Presidents deficits averaged 1.77% of GDP
Republican Presidents deficits averaged 3.42% of GDP
1981-present
Total Democratic Budget Deficits: $1004.4 billion
Total Republican Budget Deficits: $5280.1 billion
Democratic Presidents deficits averaged 2.06% of GDP
Republican Presidents deficits averaged 4.09% of GDP
1a) Deficit (total) Since World War II
Total Democratic Budget Deficits: $625.1 billion
Total Republican Budget Deficits: $4040.7 billion
Democratic Presidents deficits averaged 1.2% of GDP
Republican Presidents deficits averaged 2% of GDP
1961-present
Total Democratic Budget Deficits: $608.2 billion
Total Republican Budget Deficits: $4013.2 billion
Democratic Presidents deficits averaged 1.21% of GDP
Republican Presidents deficits averaged 2.37% of GDP
1981-present
Total Democratic Budget Deficits: $320.3 billion
Total Republican Budget Deficits: $3819.3 billion
Democratic Presidents deficits averaged 0.76% of GDP
Republican Presidents deficits averaged 2.67% of GDP
2) GDP Growth Since World War II
Average GDP growth per year under Democratic Presidents: 4.05%
Average GDP growth per year under Republican Presidents: 2.88%
1961-present
Average GDP growth per year under Democratic Presidents: 4.09%
Average GDP growth per year under Republican Presidents: 2.81%
1981-present
Average GDP growth per year under Democratic Presidents: 3.7%
Average GDP growth per year under Republican Presidents: 2.81%
3) Business Investment Growth Since World War II
Average growth per year under Democratic Presidents: 7.08%
Average growth per year under Republican Presidents: 2.94%
1961-present
Average growth per year under Democratic Presidents: 7.2%
Average growth per year under Republican Presidents: 2.95%
1981-present
Average growth per year under Democratic Presidents: 9.85%
Average growth per year under Republican Presidents: 2.29%
4) Unemployment Since World War II
Average unemployment per year during Democratic Presidents: 5.03%
Average unemployment per year during Republican Presidents: 5.93%
1961-present
Average unemployment per year during Democratic Presidents: 5.33%
Average unemployment per year during Republican Presidents: 6.24%
1981-present
Average unemployment per year during Democratic Presidents: 5.20%
Average unemployment per year during Republican Presidents: 6.41%
5) Growth in Jobs Since World War II
Average yearly growth in jobs under Democratic Presidents: 2,082,000
Average yearly growth in jobs under Republican Presidents: 1,167,000
Average yearly percent growth in jobs under Democratic Presidents: 2.67%
Average yearly percent growth in jobs under Republican Presidents: 1.36%
1961-present
Average yearly growth in jobs under Democratic Presidents: 2,391,000
Average yearly growth in jobs under Republican Presidents: 1,307,000
Average yearly percent growth in jobs under Democratic Presidents: 2.69%
Average yearly percent growth in jobs under Republican Presidents: 1.39%
1981-present
Average yearly growth in jobs under Democratic Presidents: 2,884,000
Average yearly growth in jobs under Republican Presidents: 1,253,000
Average yearly percent growth in jobs under Democratic Presidents: 2.37%
Average yearly percent growth in jobs under Republican Presidents: 1.17%
6) Growth in Pay Since World War II
Average yearly growth in weekly earnings under Democratic Presidents: 0.83%
Average yearly growth in weekly earnings under Republican Presidents: 0.408%
1961-present
Average yearly growth in weekly earnings under Democratic Presidents: 0.48%
Average yearly growth in weekly earnings under Republican Presidents: -0.30%
1981-present
Average yearly growth in weekly earnings under Democratic Presidents: 0.84%
Average yearly growth in weekly earnings under Republican Presidents: -0.34%
|
| wiggs
(1000+ posts)
Send PM |
Profile |
Ignore
|
Thu Feb-04-10 09:13 PM
Response to Reply #6 |
| MindandSoul
(1000+ posts)
Send PM |
Profile |
Ignore
|
Thu Feb-04-10 10:02 PM
Response to Reply #9 |
| 11. Sorry, I forgot to post the link to the above data. Here it is: |
|
www.presidentialdata.org/presidential_comparisons.htm
|
| Lord Helmet
(1000+ posts)
Send PM |
Profile |
Ignore
|
Thu Feb-04-10 06:41 PM
Response to Original message |
| 7. Great graphics. Could it be any more clear? |
| Cha
(1000+ posts)
Send PM |
Profile |
Ignore
|
Thu Feb-04-10 10:01 PM
Response to Original message |
| 10. Kick and thanks, Pro Sense~ |
DU
AdBot (1000+ posts)     |
Wed May 08th 2024, 05:28 PM
Response to Original message |