| Latest | Greatest | Lobby | Journals | Search | Options | Help | Login |
|
|
|
This topic is archived. |
| Home » Discuss » General Discussion |
|
| Sabriel
|
Thu Nov-03-11 09:40 AM Original message |
| Succinct income growth disparity graphic from Krugman |
| Printer Friendly | Permalink | | Top |
| sam11111
|
Thu Nov-03-11 09:45 AM Response to Original message |
| 1. the 1% have $16 trillion. pls memorize that number. |
| Printer Friendly | Permalink | | Top |
| pansypoo53219
|
Thu Nov-03-11 11:09 AM Response to Original message |
| 2. BOY, the reagan tax cuts were REALY WORTH IT. |
| Printer Friendly | Permalink | | Top |
| Marr
|
Thu Nov-03-11 11:12 AM Response to Reply #2 |
| 4. Well, they did what they were supposed to do. n/t |
| Printer Friendly | Permalink | | Top |
| Laluchacontinua
|
Thu Nov-03-11 11:11 AM Response to Original message |
| 3. Doesn't that graph show that it IS a zero-sum game? Looks like the bottom's loss went into the |
| Printer Friendly | Permalink | | Top |
| xchrom
|
Thu Nov-03-11 11:15 AM Response to Original message |
| 5. recommend |
| Printer Friendly | Permalink | | Top |
| econoclast
|
Thu Nov-03-11 11:18 AM Response to Original message |
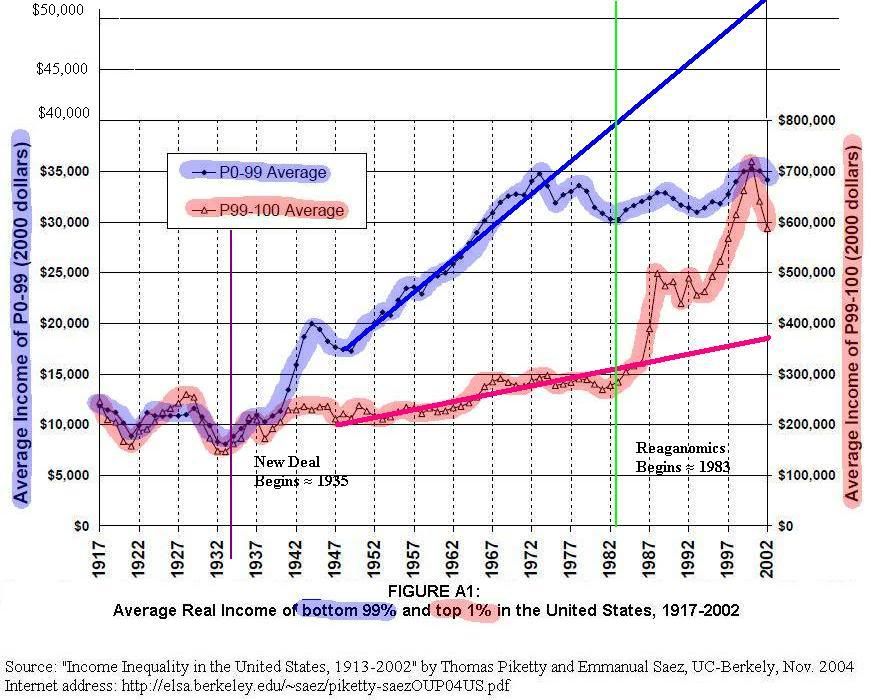
| 6. Whatever happened to the bottom 99% started in the 1970s. See graph below |
| Printer Friendly | Permalink | | Top |
| DU
AdBot (1000+ posts) |
Tue Apr 23rd 2024, 06:17 AM Response to Original message |
| Advertisements [?] |
| Top |
| Home » Discuss » General Discussion |
|
Powered by DCForum+ Version 1.1 Copyright 1997-2002 DCScripts.com
Software has been extensively modified by the DU administrators
Important Notices: By participating on this discussion board, visitors agree to abide by the rules outlined on our Rules page. Messages posted on the Democratic Underground Discussion Forums are the opinions of the individuals who post them, and do not necessarily represent the opinions of Democratic Underground, LLC.
Home | Discussion Forums | Journals | Store | Donate
About DU | Contact Us | Privacy Policy
Got a message for Democratic Underground? Click here to send us a message.
© 2001 - 2011 Democratic Underground, LLC