Jobless Claims in U.S. Fall to Match Lowest Level Since 1973
Source: Bloomberg
The number of Americans submitting applications for jobless benefits unexpectedly declined last week to match the fewest in four decades.
Initial unemployment claims dropped by 7,000 to 255,000 in the week ended Oct. 10, a Labor Department report showed Thursday. The median forecast of economists surveyed by Bloomberg called for 270,000 applications. The decline brought the monthly average to its lowest level since December 1973.
“These numbers are pretty impressive,”said Brian Jones, senior U.S. economist at Societe Generale in New York, who correctly projected the number of applications. “Both the initial and continuing claims numbers are consistent with the fact that we have a labor market that’s fairly tight and continues to improve.”
http://www.bloomberg.com/news/articles/2015-10-15/jobless-claims-in-u-s-decrease-to-match-lowest-level-since-1973
Read more: http://www.bloomberg.com/news/articles/2015-10-15/jobless-claims-in-u-s-decrease-to-match-lowest-level-since-1973
 = new reply since forum marked as read
Highlight:
NoneDon't highlight anything
5 newestHighlight 5 most recent replies
= new reply since forum marked as read
Highlight:
NoneDon't highlight anything
5 newestHighlight 5 most recent replies

FBaggins
(26,732 posts)
 Chart
Chart
uawchild
(2,208 posts)Crappy low paying jobs padding the employment numbers don't tell the whole story:
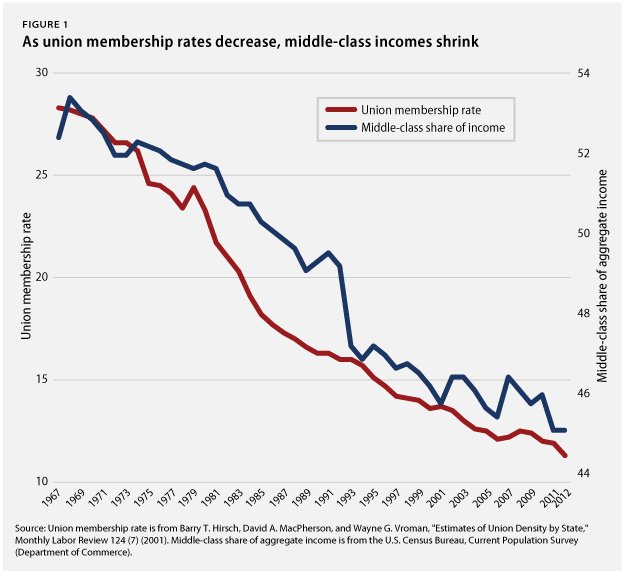
The share of middle class income has steadily declined over the last 45 years. The 1% has prospered, the rest of us are being impoverished.

Recursion
(56,582 posts)So...
uawchild
(2,208 posts)I would greatly appreciate seeing your source for this. Thanks in advance. The info I showed was the % share of aggregate income. If the counter argument is we are all better off now then ever, well, this info seems to feel things HAVE stagnated since the 1970's"
"The income growth of the average American family closely matched that of economic productivity until some time in the 1970s. While it began to stagnate, productivity has continued to climb.[7] According to the 2014 Global Wage Report by the International Labor Organization, the widening disparity between wages and productivity is evidence that there has been a significant shift of GDP share going from labor to capital, and this trend is playing a significant role in growing inequality.[8]"

Also, "real wages" might have risen somewhat, but does that figure really take into account the increases in cost of living? Working families sure don't feel better of than they were in the 1970's, but I conceded the point that the top 1%, 10% and even top 25% might be actually be enriched by Republican policies over that span.

This is from the article Middle-Class Squeeze on Wikipedia.
https://en.wikipedia.org/wiki/Middle-class_squeeze

whatthehey
(3,660 posts)Being a servlet you'll have to select your own date range, which goes back to 79 at the furthest, but does show modest real, constant dollar weekly median wages. 335 to 341 in 1982 dollars.
A reminder to all readers that medians are not skewed by Gates/Koch outliers like means, as they rank everyone from top to bottom and select the person in the exact middle.
uawchild
(2,208 posts)Here's another data point backing up the argument that the 1970's were when the economic well being of American workers maxxed out:
Its from "The Sad State Of America's Middle Class, In 6 Charts"
http://www.huffingtonpost.com/2015/01/20/middle-class-charts_n_6507506.html
Recursion
(56,582 posts)That wasn't what we were talking about, was it?
uawchild
(2,208 posts)Last edited Thu Oct 15, 2015, 05:10 PM - Edit history (1)
What we are talking about is the economic well being of American families, if you choose to focus on just one measure, fine, but even your point has been addressed as not being comprehensive of the real picture. Median income is a crude crude measure. I offered breakdowns of income growth per quintiles to show how misleading just using a median number could be.
whatthehey
(3,660 posts)I have purchasing power of X, and am willing to trade my time for X in purchasing power (nominal numbers are useless - it's what I can do with my dollars that matters, same for anyone). Now if my boss's boss's boss makes 5X or 30X that makes no difference to what I can enjoy with my X. Similarly if the lowest paid employee makes 0.1X or 0.9X it makes no difference to me personally. Politically yes we can decry the inequality of a .1X to 30X range, but if I'm a median earner it does not affect my lifestyle. As long as X means I can buy at least the same and preferably a bit more than it did last year, that bigwig's 30X can become 2000X, and my share of total income much much less as shown in your chart, but as long as the real value of X increases, I as a hypothettical median earner am better off.
That's exactly what we are seeing. The median guy is marginally better off, but the guys who can buy the robots and ERP systems are much much much better off.
Recursion
(56,582 posts)The light blue line is higher than it was in 1973, and that's in constant dollars.
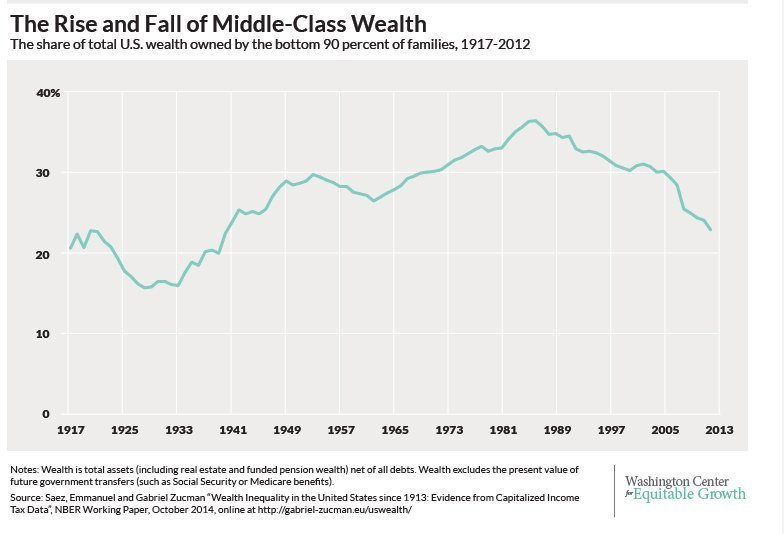
uawchild
(2,208 posts)
"U.S. economic growth is not translating into higher median family incomes. Real GDP per capita has increased since the year 2000 while the real median income per household has not, indicating a trend of greater income inequality.[9]"
I saw a graph somewhere that showed the American worker's economic well being actually peaked in the 1970's, I will try to find it, but from everything I have read and experienced, I would believe that could very well be the case.
Recursion
(56,582 posts)I noticed your chart started at 1994, the start of the largest growth in real median incomes in the past 70 years.
JackRiddler
(24,979 posts)That after 42 years with an enormous net growth in the economy and unprecedented concentration of wealth a statistical Worker No. 501 of 1000 makes a nominal six dollars more in then-dollars, even as real estate in many places has been artificially inflated? Why is it so important to you to impeach the case that the ruling class are richer and more powerful than ever, the poor at least as fucked as ever, and the "middle class" in an utter state of precarity where they happen to have about the same amount of cash (big deal)? What's your stake in the fairy tale of "economic progress" under the capitalist system that has burned the planet? I know which class I belong to and have no trouble saying it. I definitely make under the median income and most of the people I know are huddled around the same level and know that the economy is utter shit and the good news about it is mostly propaganda. What about you? Where's your position in this death system?
Recursion
(56,582 posts)Wages and incomes are higher today than in 1973. Which was the question.
We're currently pushing (yes, me too) a minimum wage that at $15/hour puts every full time US worker in the top 1.5% worldwide. I think we should up it to $16 to just make it the literal 1% for rhetorical reasons if nothing else.
I support it, but we should be honest about what we're saying there.
uawchild
(2,208 posts)"Wages and incomes are higher today than in 1973. Which was the question." Actually, that was your point you raised and its just part of the discussion. My first post stated that the share of aggregate income has been steadily decreasing. Also, the flaws in just using simple measures like median income as a true measure of economic well being were discussed. The information on the real wealth of americans being in decline was also one of the questions. A graph was provided that showed that the average income, well it might have risen a lot for the total population, stayed flat for almost 60% of Americans.
uawchild
(2,208 posts)
Hmmm, look at that. Average Hourly Earnings of Production and non-Supervisory Employees are LOWER now than in the 1970s. I would bet dollars to doughnuts that retail and service employees suffer similarly, it sure seems that way to me from my personal observations.
https://en.wikipedia.org/wiki/Household_income_in_the_United_States
So, once again, using a single crude measure like a total average or a total median value does not even come close to giving a true picture of the economic well being of most American families.
whatthehey
(3,660 posts)I have anecdotes too. It's absolutely impossible to get a seat in a midprice restaurant here most evenings. Not the swanky truffles and champagne places of the 1% (not that kind of area) but still a place that charges $6-7 for a decent 20oz beer and $10 for burgers. So a place that depends on this supposedly disappearing middle class for sure - you are unlikely to see Trump or the Kochs at a Red Robin. I even have data too. In 2004 there were 300 BWW locations - loud, eternally crowded, overpriced places where decidedly blue and grey collar types spend a fortune watching people throw balls of various sizes on TVs the size of a Napoleonic warship's mainsail. In 2008 at the height of the recession there were 500. Today it's over 1000. You'll find a line waiting for a table at most of them within 4 hours from now. It's not the 1% doing that, it's those median earners spending those real dollars from the posted data you don't believe.
JackRiddler
(24,979 posts)You are not talking about anything I said, and the data is clear: no income growth for median, enormous income and wealth growth for the ruling class, and a lot of bullshit flying in their defense from people who make you wonder just what they gain from it aside from getting to identify with "their betters."
whatthehey
(3,660 posts)uawchild
(2,208 posts)Median income is a better measure than average income, that's true, but it's still a crude measure of actual incomes and how they are distributed. for example if 50% + 1 person made a million dollars and everyone else made nothing, the median income would be one million dollars.
Lets look more closely at whose income rose and by how much since the 1970's at least.

gee, it seems income looks very flat for the lower two quintiles of the population and the middle quintile shows very modest growth. And as for 1994 being the start of the largest growth in median incomes in the past 70 years, well, it sure looks like the top 20% were really the only ones growing fast. Perhaps the median income did "grow" fastests starting in 1994, but it sure doesn't look like at least 60% of the country benefitted much.
Any ways, thanks for a thought provoking discussion. I just don't think even median income tells the whole story, nor does the jobless rate. Personally I think working families have seen their economic fortunes, pun intended, decline since the 1970's. And for the poorer 60% of the country there seems to be a lot of info backing that up.
Thanks again for discussing this important issue.
whatthehey
(3,660 posts)If I am better off than I was last year, does that change if a person much richer than I am is several times better off than he was last year? Does that make me less well off? Not at all! I'm still enjoying a better quality of life than I was am I not?
JackRiddler
(24,979 posts)that anyone in the middle is better off given the intensification and precarity of all forms of labor and the flat absolute income growth for the median.
whatthehey
(3,660 posts)If you think official government statistics as used by every academic, NGO and professional group in the nation are from my imagination then you are beyond all rationality.
whatthehey
(3,660 posts)To me it speaks of production which requires less human employment. Hardly a genius level insight admittedly, but one that asks a bigger question than pay rates.
Who should retain the financial productivity of a robot or integrated ERP system? The genius engineers who built it? The plutocrats who wrote the 7-9 figure checks for it? As long as either work OR capital is the means to income, it's certainly hard to say it should be allotted to the worker bees whom it replaced.
Your earlier productivity chart is not driven by machinists or stock pickers or accounting clerks magically doing manifold times the work. It's driven by automation doing it for them. I'm old enough to remember when it took someone like me (at the time a data analyst) days to run. for example, an inventory projection for next year's budget. Now it takes seconds. Heck it doesn't take me at all; it takes a clerical person to run the macros in Excel or the Crystal Reports update or the BW query I wrote many moons ago and was long paid for. Jobs like that went away, or morphed into higher level analysis done by far fewer, highly-educated specialists who needed not just data facility but business acumen and broad experience. The same goes for the guys who used to do what CNC machining centers or guided warehouse management systems do now.
Median income won't keep up with productivity because the things being productive don't get any income at all. Until we decouple site-based hierarchical employment from income (which let's be honest is decades at the very least into the future) there is no point comparing the two, and we must stick to median income alone as a measure of how QOL is explained.

winstars
(4,220 posts)
Jimbo S
(2,958 posts)I was one of 600,000 for the week. This 255,000 number is amazing.
IronLionZion
(45,433 posts)Look at Obama giving away free stuff! Dems are such job killers!..... 
I wasn't unemployed very long but I'm grateful to have gotten a great job last month with a very small company that has been growing steadily. Things are looking up in many sectors of our economy.