Environment & Energy
Related: About this forumA little temperature anomaly action
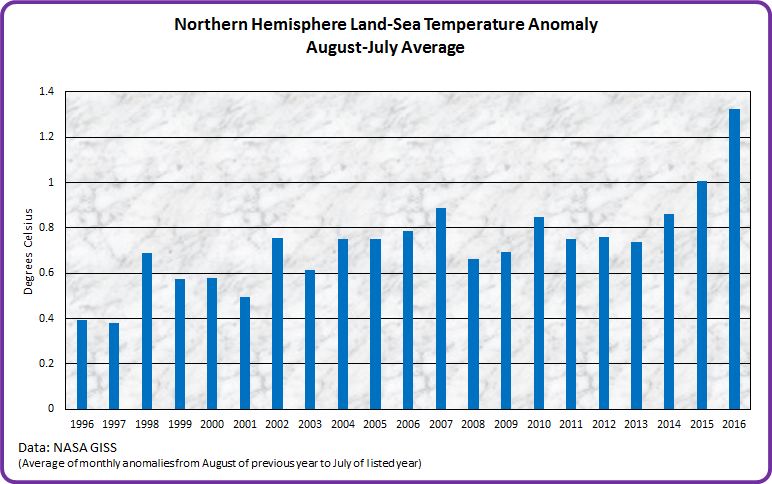
Check out those last four years. Anyone for a game of hockey? I'll bring the stick...
Stay chill! Ta ta for now.
Paul
 = new reply since forum marked as read
Highlight:
NoneDon't highlight anything
5 newestHighlight 5 most recent replies
= new reply since forum marked as read
Highlight:
NoneDon't highlight anything
5 newestHighlight 5 most recent replies
JayhawkSD
(3,163 posts)The message is valid, but why are they not comparing like months? i.e. July of one year to July of preceeding year.
I'm always suspicious of data that is presented in odd ways, especially when it is done by government agencies. Such things as "seasonal adjustments" to various data in ways that no one can explain, and data that claims that people who have become discouraged and are no longer looking for work are not unemployed.
No, I'm not questioning that our planet is warming. In fact, I suspect the issue is much worse than we know. I just don't trust statistics that are presented by my government.
GliderGuider
(21,088 posts)I averaged successive 12-month periods, starting in August and ending in July. I did that in order to include the most recent data for July, 2016. This shows the increase in the annual average anomaly rather than the increase compared to the same month in the previous year. From a climatic perspective it's a useful thing to know.
JayhawkSD
(3,163 posts)I misinterpreted the labeling, which was a bit careless on my part. I take it that this is your chart based on NASA data, so I will accept it as gospel.
I still think it understates the issue, and that at some point something logarithmic kicks in. Things are happening right now that twenty years ago were predicted to happen in a century or two. I suspect that much sooner than we imagine the grits are going to hit the fan.