Evaluating a 1981 temperature projection
James Hansen, Wide-eyed optimist...
Sometimes it helps to take a step back from the everyday pressures of research (falling ill helps). It was in this way we stumbled across Hansen et al (1981) (pdf). In 1981 the first author of this post was in his first year at university and the other just entered the KNMI after finishing his masters. Global warming was not yet an issue at the KNMI where the focus was much more on climate variability, which explains why the article of Hansen et al. was unnoticed at that time by the second author. It turns out to be a very interesting read.
They got 10 pages in Science, which is a lot, but in it they cover radiation balance, 1D and 3D modelling, climate sensitivity, the main feedbacks (water vapour, lapse rate, clouds, ice- and vegetation albedo); solar and volcanic forcing; the uncertainties of aerosol forcings; and ocean heat uptake. Obviously climate science was a mature field even then: the concepts and conclusions have not changed all that much. Hansen et al clearly indicate what was well known (all of which still stands today) and what was uncertain.
Next they attribute global mean temperature trend 1880-1980 to CO2, volcanic and solar forcing. Most interestingly, Fig.6 (below) gives a projection for the global mean temperature up to 2100. At a time when the northern hemisphere was cooling and the global mean temperature still below the values of the early 1940s, they confidently predicted a rise in temperature due to increasing CO2 emissions. They assume that no action will be taken before the global warming signal will be significant in the late 1990s, so the different energy-use scenarios only start diverging after that.
The first 31 years of this projection are thus relatively well-defined and can now be compared to the observations. We used the GISS Land-Ocean Index that uses SST over the oceans (the original one interpolated from island stations) and overlaid the graph from the KNMI Climate Explorer on the lower left-hand corner of their Fig.6.
[div style="width: 60%"] 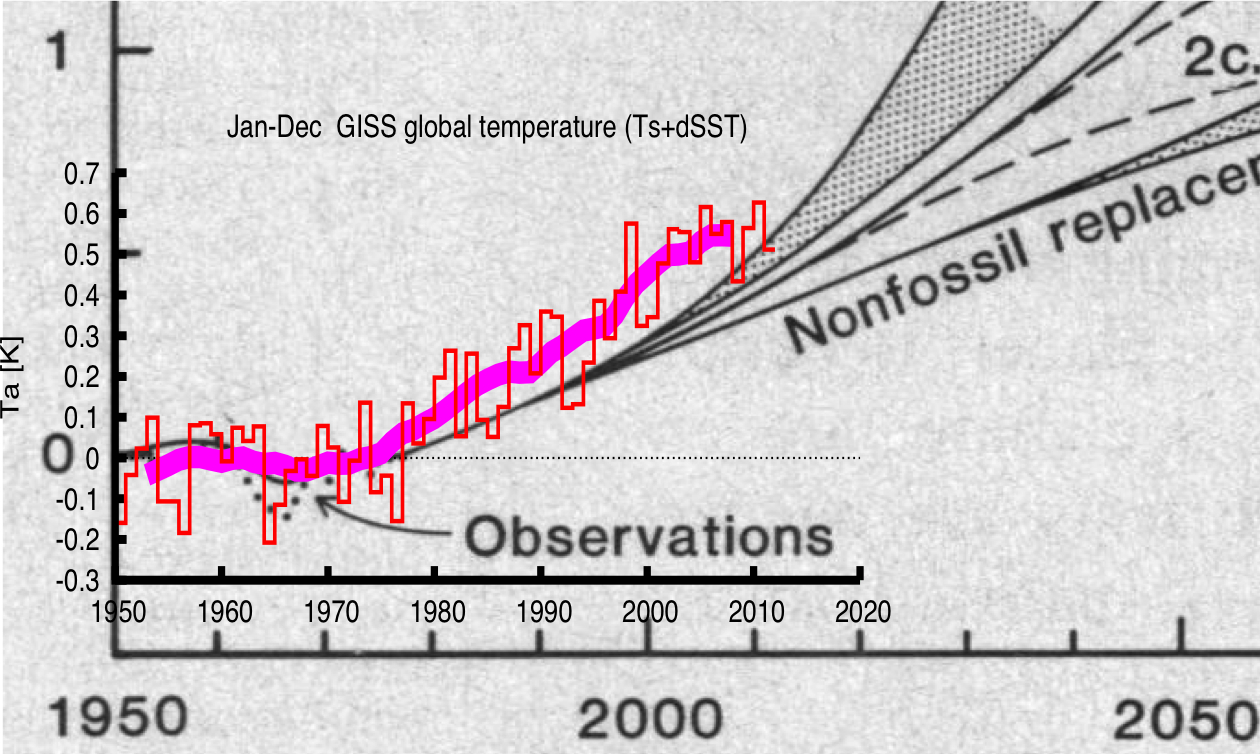
More: http://www.realclimate.org/index.php/archives/2012/04/evaluating-a-1981-temperature-projection/
Paper: http://thedgw.org/definitionsOut/..%5Cdocs%5CHansen_climate_impact_of_increasing_co2.pdf