Welcome to DU!
The truly grassroots left-of-center political community where regular people, not algorithms, drive the discussions and set the standards.
Join the community:
Create a free account
Support DU (and get rid of ads!):
Become a Star Member
Latest Breaking News
General Discussion
The DU Lounge
All Forums
Issue Forums
Culture Forums
Alliance Forums
Region Forums
Support Forums
Help & Search
Environment & Energy
Related: About this forumNational Snow And Ice Data Center - Rain At The Summit Of Greenland 8/14/21

On August 14, 2021, rain was observed at the highest point on the Greenland Ice Sheet for several hours, and air temperatures remained above freezing for about nine hours. This was the third time in less than a decade, and the latest date in the year on record, that the National Science Foundation’s Summit Station had above-freezing temperatures and wet snow. There is no previous report of rainfall at this location (72.58°N 38.46°W), which reaches 3,216 meters (10,551 feet) in elevation. Earlier melt events in the instrumental record occurred in 1995, 2012, and 2019; prior to those events, melting is inferred from ice cores to have been absent since an event in the late 1800s. The cause of the melting event that took place from August 14 to 16, 2021, was similar to the events that occurred this late July, where a strong low pressure center over Baffin Island and high air pressure southeast of Greenland conspired to push warm air and moisture rapidly from the south.

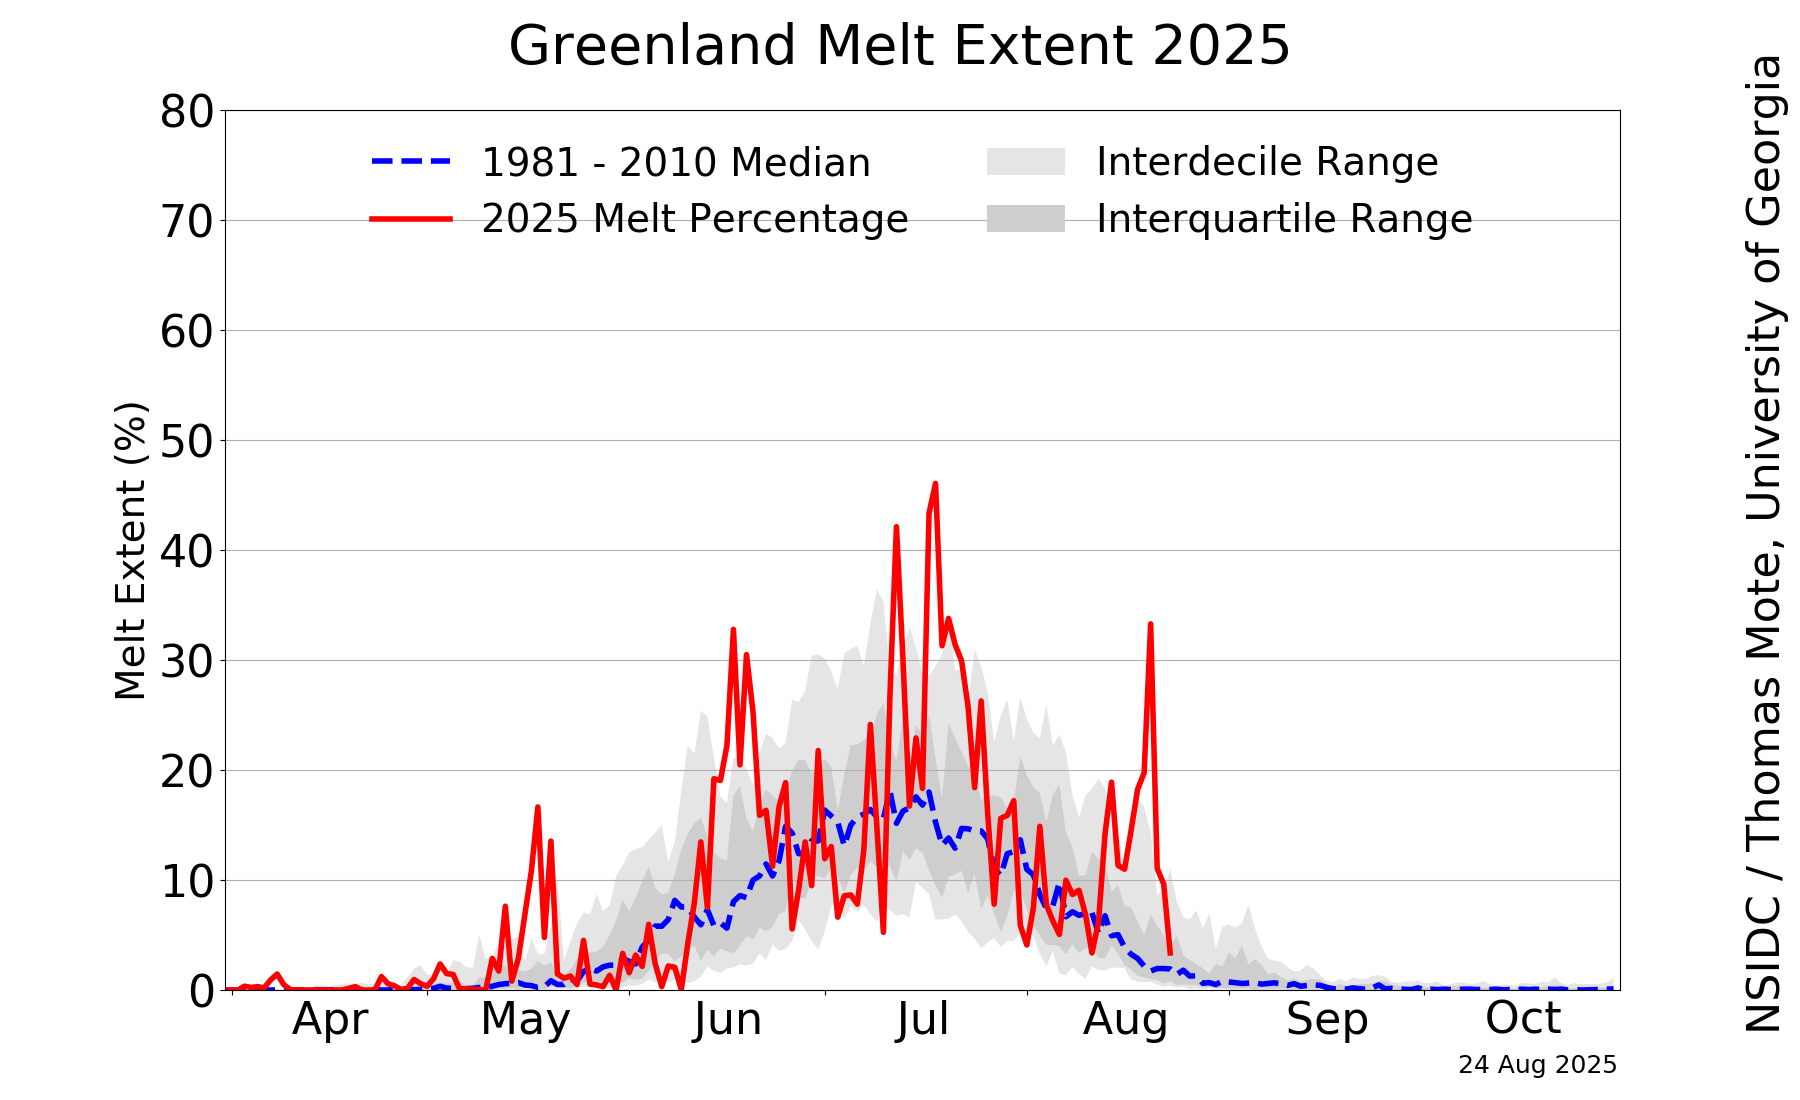
Widespread surface melting and an extensive rainfall event along the southeast coast extending up to the Summit region of Greenland occurred on August 14 and 15, with melt area returning to moderate levels on August 16 (Figure 1a). Melt extent peaked at 872,000 square kilometers (337,000 square miles)on August 14, dropping to 754,000 square kilometers on the 15 and 512,000 square kilometers (198,000 square miles) on August 16. Only 2012 and 2021 have had more than one melt event of 800,000 square kilometers (309,000 square miles) in extent, and the August 14 event was the latest date for this scale of melt extent in the satellite record.
Temperatures surpassed the freezing point at Summit Station around 0700 UTC (5:00 am local time) on August 14, and the rain event began at the same time (Figure 1b). For the next several hours, rain fell and water droplets were seen on surfaces near the camp as reported by on-station observers. At about 1400 UTC the snow surface began to form thin sheets of ice crystals as the rain froze into the snow. Winds were 9.8 meters per second (22 miles per hour) from the southwest with a mix of freezing and non-freezing rain. Temperatures peaked at 0.48 degrees Celsius (33 degrees Fahrenheit) around 10:40 UTC and dropped below freezing around 16:20 UTC. Temperatures fell steadily through the evening. As skies cleared late in the evening, a sharp cooling brought temperatures to -8.5 degrees Celsius (16.7 degrees Fahrenheit) early on August 15 (Figure 2). Temperatures at Summit did not reach the melting point on August 15 or 16.
The total aerial extent of surface melting (total melt-day extent) for 2021 through August 16 is 21.3 million square kilometers (8.2 million square miles), tied for the fourteenth highest total to date, and well above the 1981 to 2010 average of 18.6 million square kilometers (7.2 million square miles).
EDIT

Figure 2b. The top graph shows estimated daily surface runoff and the bottom graph shows daily total melt water (no rain) for several recent warm-summer years for the Greenland Ice Sheet. The grey band and dark line show the average daily values for the 1981 to 2010 reference period; the blue dotted line shows the maximum runoff or melt mass within the 1981 to 2010 record. The data are from a regional climate model run using ERA-5 reanalysis as forcing, and forecast data for the period shown following Aug 14.

Figure 3. The top panel shows air temperature in degrees Celsius from an automated weather station at South Dome, Greenland, for August 13, 14, and 15, showing the more extensive time above the freezing point for the southern area of the upper Greenland Ice Sheet. The bottom graph shows accumulated rainfall in millimeters at Crawford Point Weather Station, located above the area of meltwater ponds and runoff on the western ice sheet.
Above freezing temperatures and rainfall were widespread to the south and west of Greenland during the three-day period, with exceptional readings from several remote weather stations in the area. Total rainfall on the ice sheet was 7 billion tons. At South Dome, the highest point on the southern lobe of the ice sheet at 2,850 meters (9,350 feet) elevation melt was recorded by satellite during all three days of the warm event, and the early part of this period (Figure 3) shows the rapid warming and persistent above-freezing conditions for August 14 and 15.
EDIT
https://nsidc.org/greenland-today/
InfoView thread info, including edit history
TrashPut this thread in your Trash Can (My DU » Trash Can)
BookmarkAdd this thread to your Bookmarks (My DU » Bookmarks)
0 replies, 493 views
ShareGet links to this post and/or share on social media
AlertAlert this post for a rule violation
PowersThere are no powers you can use on this post
EditCannot edit other people's posts
ReplyReply to this post
EditCannot edit other people's posts
Rec (5)
ReplyReply to this post