Welcome to DU!
The truly grassroots left-of-center political community where regular people, not algorithms, drive the discussions and set the standards.
Join the community:
Create a free account
Support DU (and get rid of ads!):
Become a Star Member
Latest Breaking News
General Discussion
The DU Lounge
All Forums
Issue Forums
Culture Forums
Alliance Forums
Region Forums
Support Forums
Help & Search
Environment & Energy
Related: About this forumJames Hansen et al. - Global Warming Acceleration: Causes and Consequences
https://www.columbia.edu/~jeh1/mailings/2024/AnnualT2023.2024.01.12.pdf
Fig. 1. Global temperature relative to 1880-1920 based on the GISS analysis.¹ ²
Global Warming Acceleration: Causes and Consequences
12 January 2024
James Hansen, Makiko Sato, Reto Ruedy
Abstract. Record global temperature in 2023 helps reveal acceleration of global warming on decadal time scales. The proximate cause of the acceleration is increase of Earth’s energy imbalance, specifically a substantial darkening of the planet (decreased albedo) equivalent to a CO₂ increase of more than 100 ppm, although it is difficult to apportion the albedo change between aerosol forcing and cloud feedbacks because of limited global measurements. Large 2023 warming is consistent with key findings in Global Warming in the Pipeline:³ reduced aerosol cooling and high climate sensitivity. We expect record monthly temperatures to continue into mid-2024 due to the present large planetary energy imbalance, with the 12- month running-mean global temperature reaching +1.6-1.7°C relative to 1880-1920 and falling to only +1.4 ± 0.1°C during the following La Nina. Considering the large planetary energy imbalance, it will be clear that the world is passing through the 1.5°C ceiling, and is headed much higher, unless steps are taken to affect Earth’s energy imbalance.
Global temperature in the GISS analysis increased 0.28°C in 2023, from 1.16°C to 1.44°C (Fig. 1), the largest annual increase in the 144-year record. This annual rise is largely due to the ongoing tropical El Nino warming, but no prior El Nino engendered as much warming, which points to an additional drive for global warming acceleration. We have argued³ that the imminent threat of human-made climate change is understated in IPCC⁴ assessments, which are based predominately on global climate models (GCMs). We suggest that the IPCC best estimate for climate sensitivity (3°C for 2×CO₂ or 0. 75°C per W/m² ) is an underestimate, as we find real-world (paleoclimate) evidence for a sensitivity of 4.8°C ±1.2°C for 2×CO2₂ (1.2°C per W/m² ). In addition, we suggest that IPCC underestimates (negative) aerosol climate forcing and global cooling by aerosols that partly counterbalances greenhouse gas (GHG) warming. These two errors compensate and allow GCMs with low sensitivity to match observed warming of the past century by using an unrealistically small aerosol effect. Compensation is not an accident; it is a result of overreliance on GCMs. With aerosol forcing unmeasured, it is natural for modelers to focus on an aerosol forcing that yields agreement with global warming of the past century. Some clarification will be possible in 2024.
Global surface temperature is well measured since about 1950,⁵ but there are large interannual fluctuations of temperature that make it difficult to confirm a change in the rate of global warming until the change is large. Given that the El Nino/La Nina cycle is the main cause of interannual
Fig. 2. Global temperature during El Nino origin years (left side) and El Nino peak years, compared with monthly record high temperatures prior to the last three strong El Ninos.
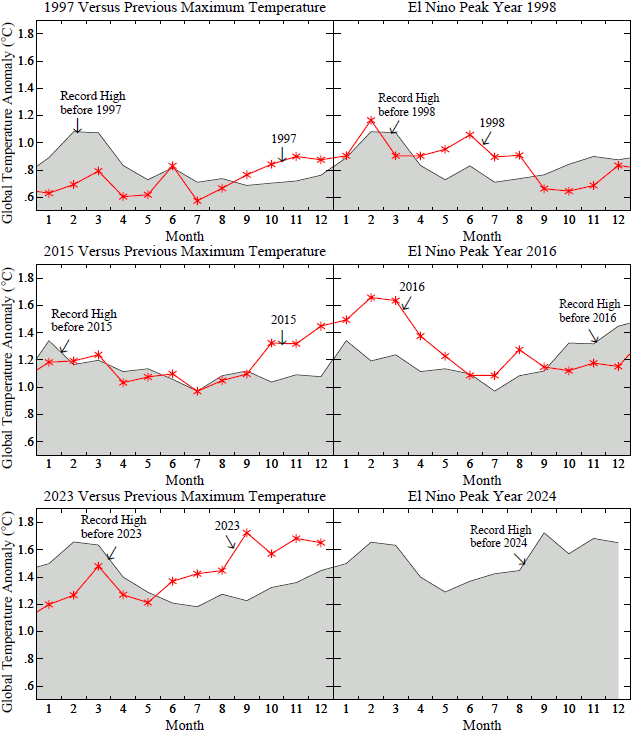
variability, comparison of global temperatures at the well-defined peaks of strong El Ninos may provide potential for early detection of global warming acceleration.⁶ The three most recent strong El Ninos are 1997-98, 2015-16, and 2023-24. The first of these was prior to reduction of human-made aerosols. The second occurred just after the January 2015 imposition of restrictions on sulfur content of ship fuels by the International Maritime Organization (IMO), and the third occurred after strengthening of the restrictions in January 2020. Fig. 2 compares global temperatures during these years (red lines) with the prior record monthly temperatures (gray area).
The strong 1997-98 “El Nino of the century” produced 8-9 clear global temperature records, the 2015-2016 El Nino produced 10 clear record months, and the 2023-24 El Nino has already produced 7 record months about half way through the period of Nino-elevated temperature. The rate of warming between the first two El Ninos, i.e., between 1998 and 2016, was 0.23°C/decade, moderately larger than the 0.18°C/decade warming rate during 1970-2010. Another eight months of temperature data are needed to assess the warming rate between the last two El Ninos.
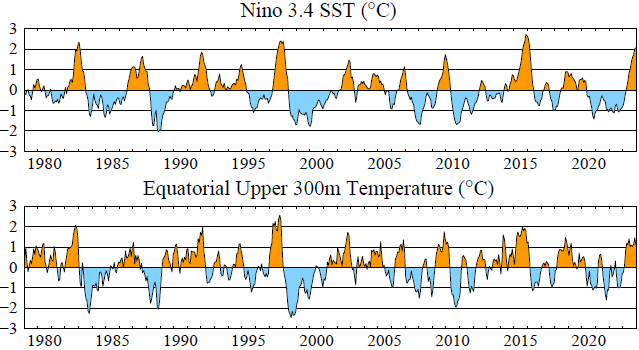
Fig. 3. Nino3.4 SST (upper panel) and temperature of ocean upper 300m in equatorial region.⁷
…
¹ Lenssen NJL, Schmidt GA, Hansen JE et al. Improvements in the GISTEMP uncertainty model, J Geophys Res Atmos 2019;124(12):6307-26
² Hansen J, Ruedy R, Sato M et al. Global surface temperature change. Rev Geophys 2010;48:RG4004
³ Hansen J, Sato M, Simons L et al. Global warming in the pipeline. Oxford Open Clim Chan 2023;3(1):kgad008, doi.org/10.1093/oxfclm/kgad008
⁴ IPCC. Climate Change 2021: The Physical Science Basis [Masson-Delmotte V, Zhai P, Pirani A et al. (eds)]. Cambridge and New York: Cambridge University Press, 2021
⁵ There were still significant flaws in the World War II period because of limited and changing sources for sea surface temperature data. See Hansen J, Sato M, Kharecha P et al. Young people's burden: requirement of negative CO₂ emissions. Earth Syst Dyn 2017;8:577-616
⁶ Grantham, J., The Race of Our Lives Revisited, GMO White Paper, August 2018
⁷ Nino3.4 data are ERSSTv5 (1991-2020 base period) for 5°S-5°N, 170-120°W, while the equatorial upper 300m temperature data use 1981-2010 base period.for 5°S-5°N, 180-100°W1744
…
InfoView thread info, including edit history
TrashPut this thread in your Trash Can (My DU » Trash Can)
BookmarkAdd this thread to your Bookmarks (My DU » Bookmarks)
11 replies, 655 views
ShareGet links to this post and/or share on social media
AlertAlert this post for a rule violation
PowersThere are no powers you can use on this post
EditCannot edit other people's posts
ReplyReply to this post
EditCannot edit other people's posts
Rec (8)
ReplyReply to this post
11 replies
 = new reply since forum marked as read
Highlight:
NoneDon't highlight anything
5 newestHighlight 5 most recent replies
= new reply since forum marked as read
Highlight:
NoneDon't highlight anything
5 newestHighlight 5 most recent replies
= new reply since forum marked as read
Highlight:
NoneDon't highlight anything
5 newestHighlight 5 most recent replies
James Hansen et al. - Global Warming Acceleration: Causes and Consequences (Original Post)
OKIsItJustMe
Jan 2024
OP
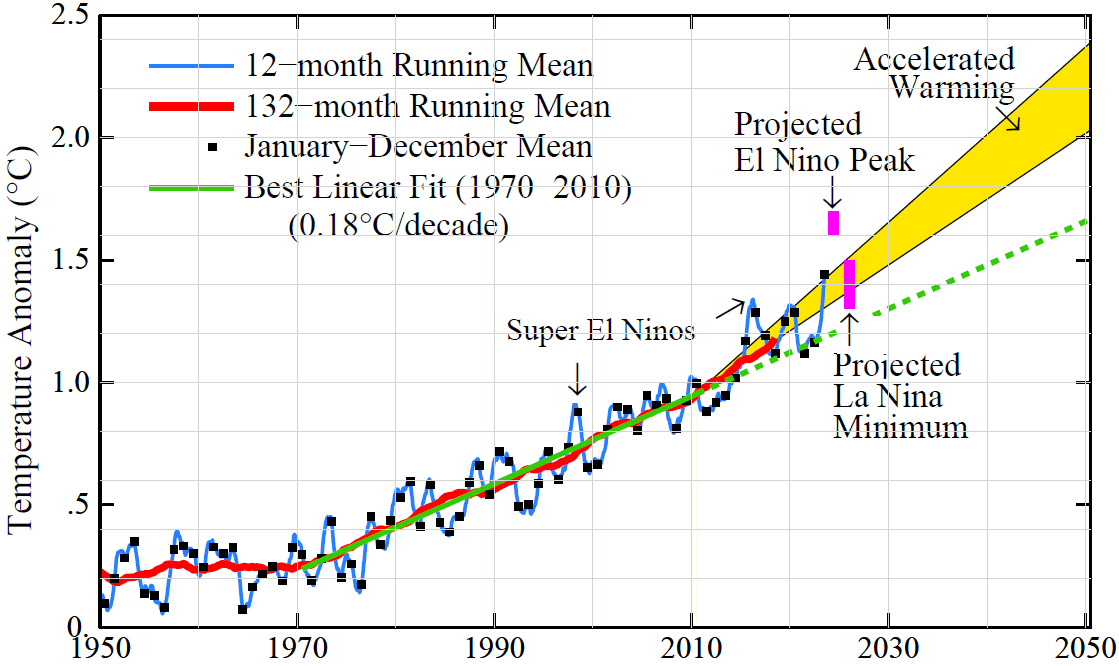
Fig. 6. Global temperature relative to 1880-1920 based on the GISS analysis.
OKIsItJustMe
Jan 2024
#3
I figure the land dispute in Israel/Palestine will be moot in the near future
OKIsItJustMe
Jan 2024
#5

Shell_Seas
(3,333 posts)1. Are we going to die?

OKIsItJustMe
(19,938 posts)2. Let's just say, "Things do not look good."
https://democraticunderground.com/1127171811
Abstract. December was the 7th consecutive month of record-shattering global temperature, driven by the combination of a moderately strong El Nino and a large decrease of Earth’s albedo. The El Nino will fade in the next few months, but we anticipate that the string of record monthly temperatures will continue to a total of 12 and possibly 13 months because of Earth’s unprecedented energy imbalance. By May the 12-month running-mean global temperature relative to 1880-1920 should be +1.6-1.7°C and not fall below +1.4 ± 0.1°C during the next La Nina minimum. Thus, given the planetary energy imbalance, it will be clear that the 1.5°C ceiling has been passed for all practical purposes.
OKIsItJustMe
(19,938 posts)3. Fig. 6. Global temperature relative to 1880-1920 based on the GISS analysis.

IbogaProject
(2,816 posts)4. Mostly
Summer humid heat waves and food disruptions will be a lethal double whammy.
OKIsItJustMe
(19,938 posts)5. I figure the land dispute in Israel/Palestine will be moot in the near future
Since it’s at the leeward end of the Mediterranean, it’s been warming at ~ twice the rate of the rest of the planet…
Hermit-The-Prog
(33,349 posts)6. Damn! That very first chart appears to show a 45 degree slope.
Time to deploy geostationary mirrors while we get our energy act together.
OKIsItJustMe
(19,938 posts)7. I think you'll see stratospheric sulfate injection first
(What could possibly go wrong?)
IbogaProject
(2,816 posts)8. The angle is misleading
It's based on a narrow scale. However even a couple of degrees higher over the whole planet's average over time will cause havoc.
Hermit-The-Prog
(33,349 posts)9. xkcd has a much larger scale...
Can't post the image here, in spite of the friendly license allowing it, because it is so very, very long. You have to scroll through the ages to get to now.
https://xkcd.com/1732/
IbogaProject
(2,816 posts)11. That really gives a good perspective
Thank you! I've seen that before.
OKIsItJustMe
(19,938 posts)10. Compare figures 1 & 6
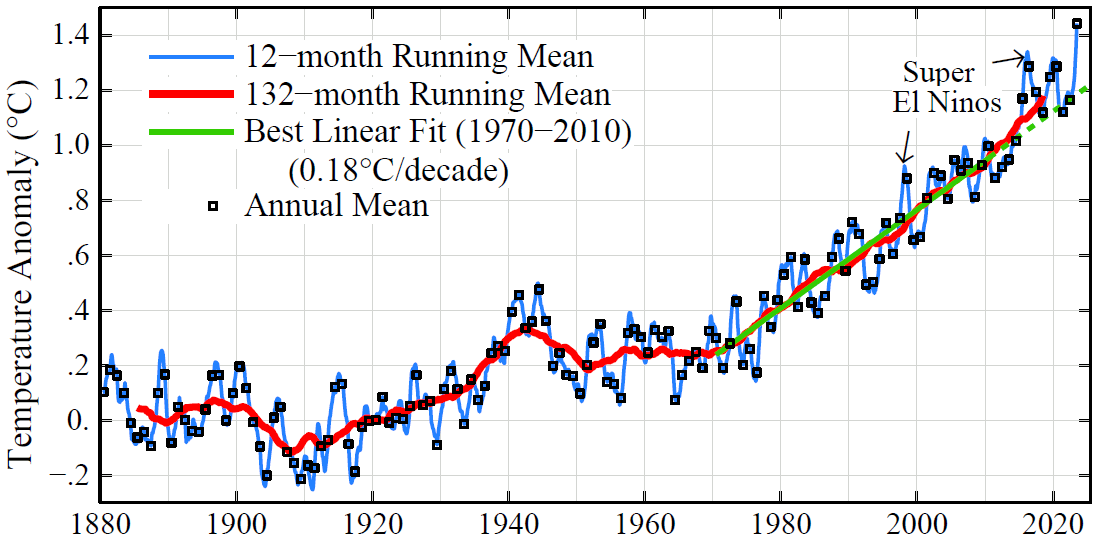
Figure 1 shows 1880 to present day, Figure 6 shows 1950 to 2050. Both Y axis are scaled to show the full extent of warming.