Environment & Energy
Related: About this forumNo wonder wind, solar and batteries are growing so fast...
Just like with nuclear - critical parts are backordered years
Link to tweet
?s=20
 = new reply since forum marked as read
Highlight:
NoneDon't highlight anything
5 newestHighlight 5 most recent replies
= new reply since forum marked as read
Highlight:
NoneDon't highlight anything
5 newestHighlight 5 most recent replies

NNadir
(38,985 posts)There are of course, people who consider tweets to be reputable sources; this is a measure of how poor thinking has become on this planet.
I wonder how it is that China has built more than 60 nuclear reactors in this century and has 39 under construction.
Got a clue?
Chinese nuclear power plants operating and under construction.
It doesn't seem like the antinukes in Germany have much trouble building gas plants.
Germany says new gas power plants will be online by 2031 following EU deal
Sorry, but the antinuke fantasy of tearing the shit out of the Earth's surface for mines run by slaves for bourgeois battery worshipping types, despoiling vast areas of wilderness, has never, not once allowed the solar and wind industry to produce the 31 Exajoules of primary energy nuclear energy produces each year.
We've been hearing about how fast solar and wind grow for decades. How come the planet is in flames?
Solar and wind are trivial, expensive and useless forms of energy - if being "useful" had something to do with addressing the use of fossil fuels, about which antinukes and "I'm not an antinuke" couldn't care less. After more than 5 trillion dollars squandered on them in the last ten years alone, combined they produce just about 18 Exajoules of energy - the unit of energy is the Joule, not the (peak) Watt - and have never grown as fast as fossil fuels grow each year:
Here, from the most recent edition, are the figures, in Exajoules, for the primary energy produced from each energy source in the most recent edition: World Energy Outlook 2025:
Page 420.
A battery, if one has taken a good high school or college level science course involving thermodynamics, is a device that destroys exergy. If solar and wind were really backed up by batteries, the result would be to make the available energy even less than the trivial 18 Exajoules for a 5.6 trillion dollar expense. But overwhelmingly, solar and wind are not backed up by batteries; they're backed up by fossil fuels, about which, again, antinukes couldn't care less. The batteries, like solar and wind themselves, and like hydrogen, are lipstick on the fossil fuel pig.

Finishline42
(1,191 posts)Then there's the continued drop in cost - over 50% since 2022 All the while the cost of critical components to a thermal power plant is going thru the roof.
Link to tweet
?s=20
NNadir
(38,985 posts)...if they were really backed up by batteries instead of fossil fuels, would produce instead of the trivial 18 Exajoules, 16.2 Exajoules = 18 EJ X .90.
Of course the useless solar and wind industries actually rarely produce enough energy to justify the enormous moral, environmental and economic cost of ripping the shit out of central Africa and other places in order to put a fraudulent loincloth, batteries, to obscure their intrinsic lack of reliability. Battery loses are trivial not because the batteries are immune to the laws of thermodynamics but because after trillions of dollars squandered, solar and wind are trivial forms of primary energy. They do not matter on any scale of importance.
One doesn't build, unless one is a fool - and there apparently no shortage of such fools - an industrial facility to cover and event that might take place for three or four hours on five or six days out of the 8766 hours in a sideral year. Such is the mysticism surrounding the so called "renewable energy" scam that people actually do engage in this disastrous approach, in order to pretend that solar and wind are reliable. Most of the times batteries are charged by the combustion of fossil fuels.
Solar and wind are not reliable, not sustainable, not clean and my view is that they represent a crime not only against the slave miners in Africa where the battery scam is run, but against all future generations.
Further, this ignores the vast damage done to ecosystems by so called "renewable energy," particularly with respect to solar energy.
We are not going to mine our way out of the climate disaster we now are experiencing.
So called "renewable energy" is lipstick on the fossil fuel pig.
There is one, and only one, alternative to fossil fuels. It's nuclear energy.
Have a nice day.

OKIsItJustMe
(22,504 posts)In the diagram in the tweet you’ve linked to, you’re seeing an example of “peak shaving,” Surplus solar power, generated at peak times, is stored for a few hours, and released, to help level off the supply. NREL experimented with storing hot molten salt to level off output from a concentrating solar plant in the Southwest, taking multiple factors into account, they found that about 8 hours of storage was optimal. Most BESS farms are well short of that, but, let’s pretend we can get 24 hours of level power out of all variable sources, like solar and wind.
What if there is an extended period of time (say, a few days or more) when conditions are not well suited to generation? (i.e. a “renewable energy drought.”)
Bracken, C., Voisin, N., Mongird, K., Burleyson, C. D., & Oikonomou, K. (2025). Intensifying renewable energy droughts in the Western U.S. amid evolving infrastructure and climate. Earth's Future, 13, e2024EF005313. https://doi.org/10.1029/2024EF005313
Abstract
If renewable energy resources continue to become a larger part of the generation mix in the United States (U.S.), so does the potential impact of prolonged periods of low wind and solar generation, known as variable renewable energy (VRE) droughts. In such a future, naturally occurring VRE droughts need to be evaluated for their potential impact on grid reliability. This study is the first of its kind to examine the impacts of compound VRE energy droughts in the Western U.S. across a range of potential future climate and infrastructure scenarios. We find that compound VRE drought severity may increase significantly in the future, primarily due to the dramatic increase in wind and solar generation needed in some future infrastructure scenarios. We find that in our future climate scenario, the variability of energy drought severity increases, which has implications for sizing energy storage necessary for mitigating drought events. We also examine the spatial patterns of compound VRE drought events that effect multiple regions of the grid simultaneously. These co-occurring events have distinct spatial patterns depending on the season. We observed overall fewer connected events in the future with the combined effect of potential climate and infrastructure changes, although in the fall we observe a climate-induced shift toward events which impact more regions simultaneously.
…
Here in New York State, we go through extended periods of time when there is less solar radiation available, so much so (in fact) that we experience much colder temperatures, since the sun is not providing as much heat. We call this phenomenon, “Winter.”
Here’s a handy graph for London (they’re at a similar latitude):

PV Solar does not become useless in the Winter, merely much less useful. This is a bit of a cruel irony; just when people need the most energy to heat buildings, there’s much less solar power available to do it with. This is not something which you can cover with a few hours worth of battery capacity. Some sort of seasonal storage is necessary. One possibility which has been suggested for years is hydrogen, however, that presents challenges of its own.
Most experts point to some “dispatchable generation," that can act as backstop for variable renewable energy. Clearly, we would prefer it not be fossil fuels (although for a time this is likely.) More and more, we would want to see clean dispatchable sources, (e.g. nuclear fission, nuclear fusion) resulting in a grid that looks like this, where variable renewables dominate generation, with nuclear providing about the same amount as “hydro” (which is also “dispatchable” to an extent.)
IEA (2025), World Energy Outlook 2025, IEA, Paris https://www.iea.org/reports/world-energy-outlook-2025, Licence: CC BY 4.0 (report); CC BY NC SA 4.0 (Annex A)
OKIsItJustMe
(22,504 posts)Please note: Material below is drawn from a Creative Commons source:
IEA (2025), Renewables 2025, IEA, Paris https://www.iea.org/reports/renewables-2025, Licence: CC BY 4.0
Below, reference is made to a “Low-RES scenario”:
(Begining on Page 80)
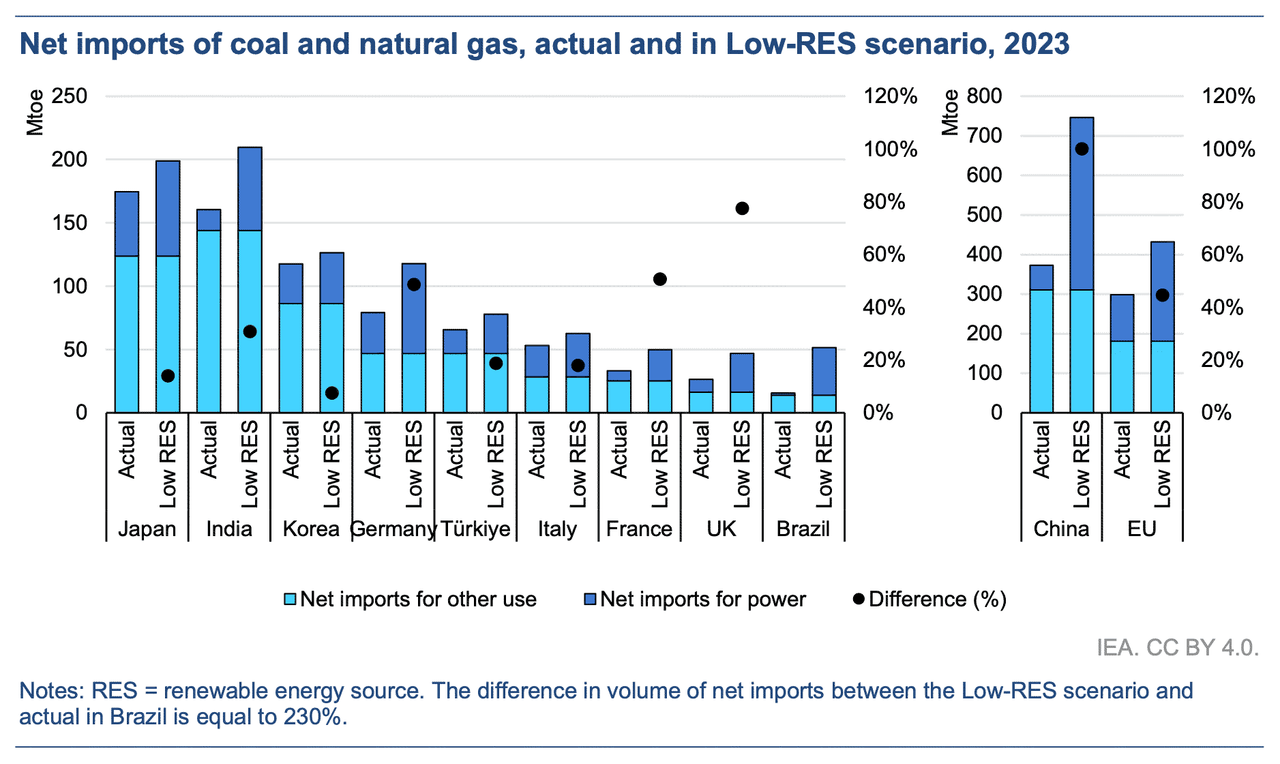
From non-hydro renewable power generation capacity added between 2010 and 2023, approximately 3 200 TWh of electricity was generated in fuel-importing countries in 2023. Replacing this output with fossil fuels would require significantly higher energy inputs due to their lower conversion efficiencies. For example, typical coal and open-cycle gas turbine power plants operate at 30-40% efficiency, while combined-cycle gas turbines reach 50-60%. This means that each GWh of renewable electricity produced avoided the need for 2-3 GWh of fossil fuel inputs. For instance, 1 GW of solar PV capacity in Europe generates roughly 1 000 GWh annually, equivalent to burning around 3 000 GWh of coal, or approximately 400 000 tonnes.
As a result, global imports of coal and gas in 2023 would have been around 45% higher – equivalent to over 8 000 TWh of additional fuel inputs – without non-hydro renewable energy developments since 2010. This means roughly 700 million tonnes of coal and 400 billion cubic metres of natural gas, together representing about 10% of total global consumption of these fuels in 2023.
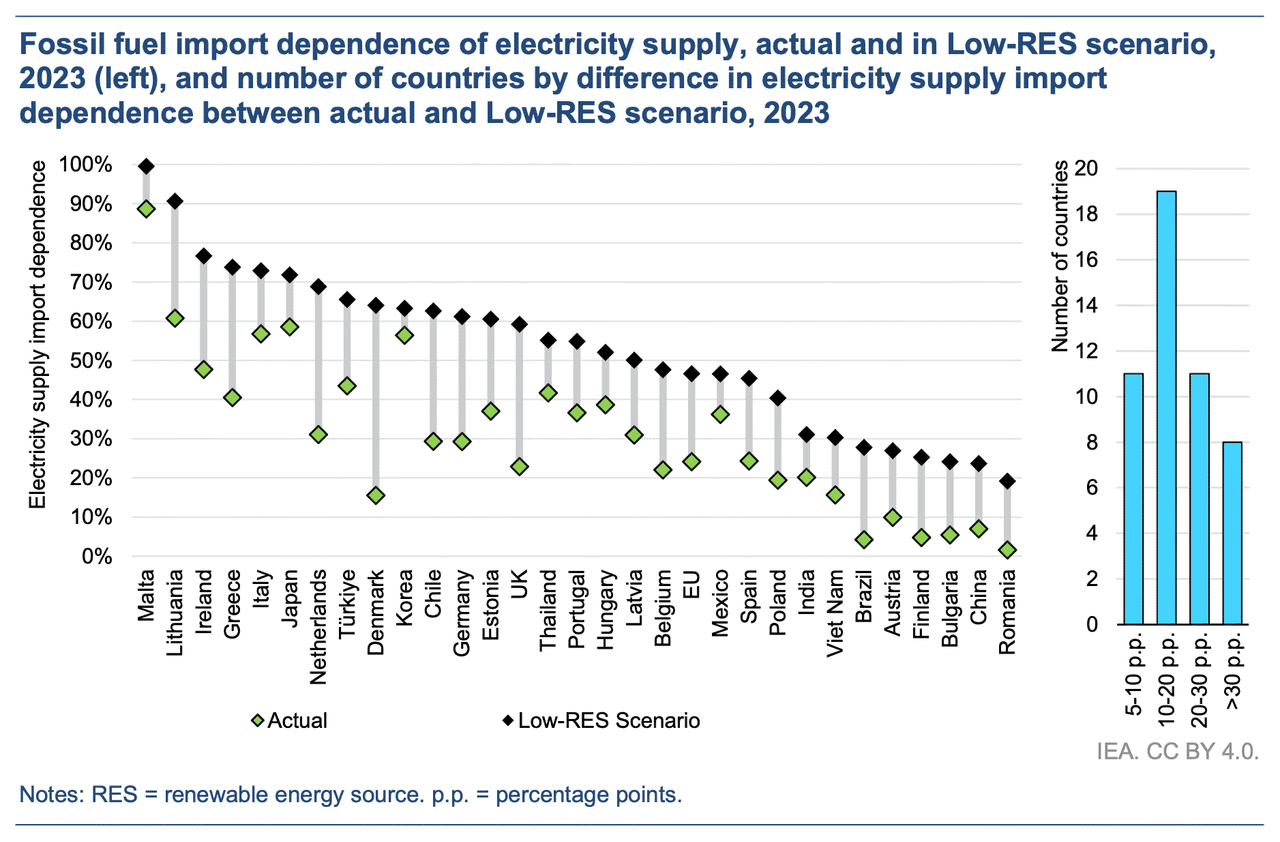
The Low-RES scenario results in a substantial increase in reliance on imported fuels for electricity generation, significantly raising energy security risks in many countries. This impact is especially pronounced in countries with limited domestic energy resources, where renewables have played a key role in avoiding high import dependence. In the absence of renewable energy deployment, countries such as Germany, Italy, the Netherlands, the United Kingdom, Denmark, Türkiye, Chile, Thailand and Japan would have greater fossil fuel-based generation, increasing their vulnerability to supply disruptions.
In the European Union, limited domestic fossil fuel resources have long been the main driver behind renewable energy incentives. In 2023, about one-quarter of the EU electricity supply was met by imported fossil fuels. Without wind, solar PV and bioenergy deployment over the previous decade, this share would have reached nearly 50%. The impact is most striking for Denmark, the Netherlands, Germany and Greece, where the difference could have been as much as 30-50 percentage points. In the Low-RES scenario, the energy security challenges during the 2022 energy crisis would have been significantly more severe.
The United Kingdom expanded its non-hydro renewable electricity generation nearly sixfold between 2010 and 2023. As a result, the share of its electricity supply met by imported fossil fuels decreased from around 45% in 2013 to less than 25% in 2023, despite declining domestic coal and gas output. In the Low-RES scenario, import dependence would have approached 60% by 2023.
In China, despite massive domestic coal production, imports made up about 10% of the country’s total coal supply in 2023 – and nearly 40% of its natural gas. Without deployment of renewables over the past decade, China’ s fossil fuelbased electricity generation would have been more than 25% higher. This would have potentially required a doubling of fossil fuel imports, raising China’s electricity supply import dependence from 7% to nearly 25%.
Brazil, with one of the lowest fossil fuel import dependencies among large economies – around 5% in 2023 – would also have experienced significant impacts. Without wind and solar energy deployment, fossil-based generation would have needed to rise by around 170 TWh, primarily from imported natural gas. Imports of natural gas would have increased nearly five-fold, pushing electricity import dependence to almost 30%, despite the country’s large hydropower base.
…
OKIsItJustMe
(22,504 posts)Please note: this is quoted from a Creative Commons source:
IEA (2025), World Energy Outlook 2025, IEA, Paris https://www.iea.org/reports/world-energy-outlook-2025, Licence: CC BY 4.0 (report); CC BY NC SA 4.0 (Annex A)
The NZE Scenario illustrates a possible global path to the goal of net zero emissions by 2050. Each country will have its own pathway, depending on their circumstances. The energy transition set out in the NZE Scenario has four main pillars: deployment of low-emissions sources of electricity and electrification to reduce emissions in end-uses; improvements in energy efficiency; use of low-emissions fuels such as hydrogen, biofuels, and CCUS; and reductions in methane emissions. These strategies rapidly reduce emissions and drive a demand-led transition away from fossil fuels in this scenario.
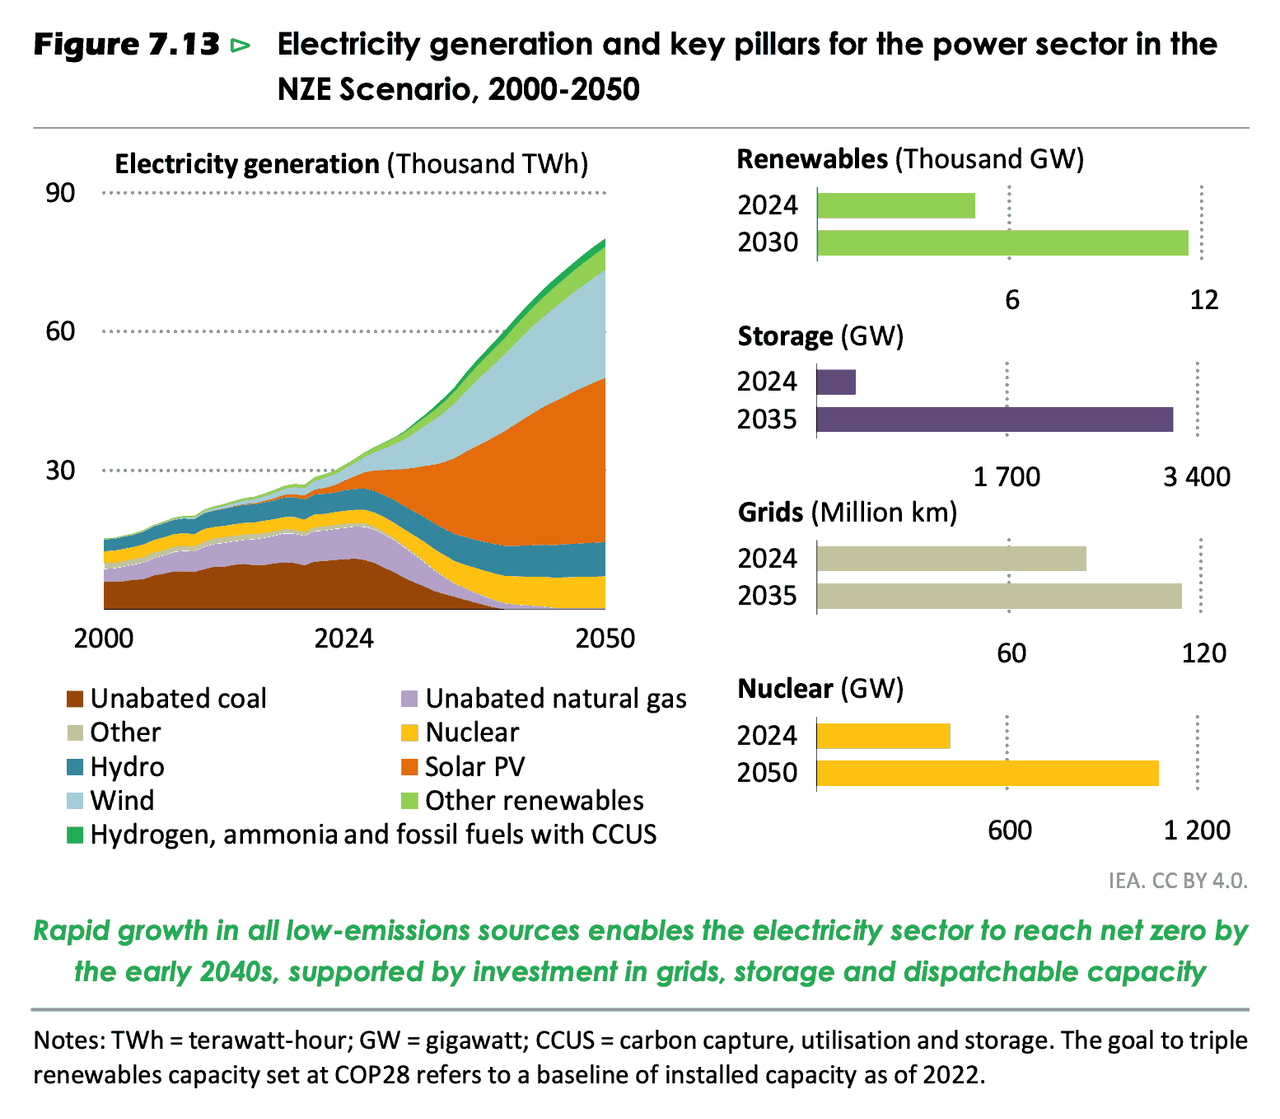
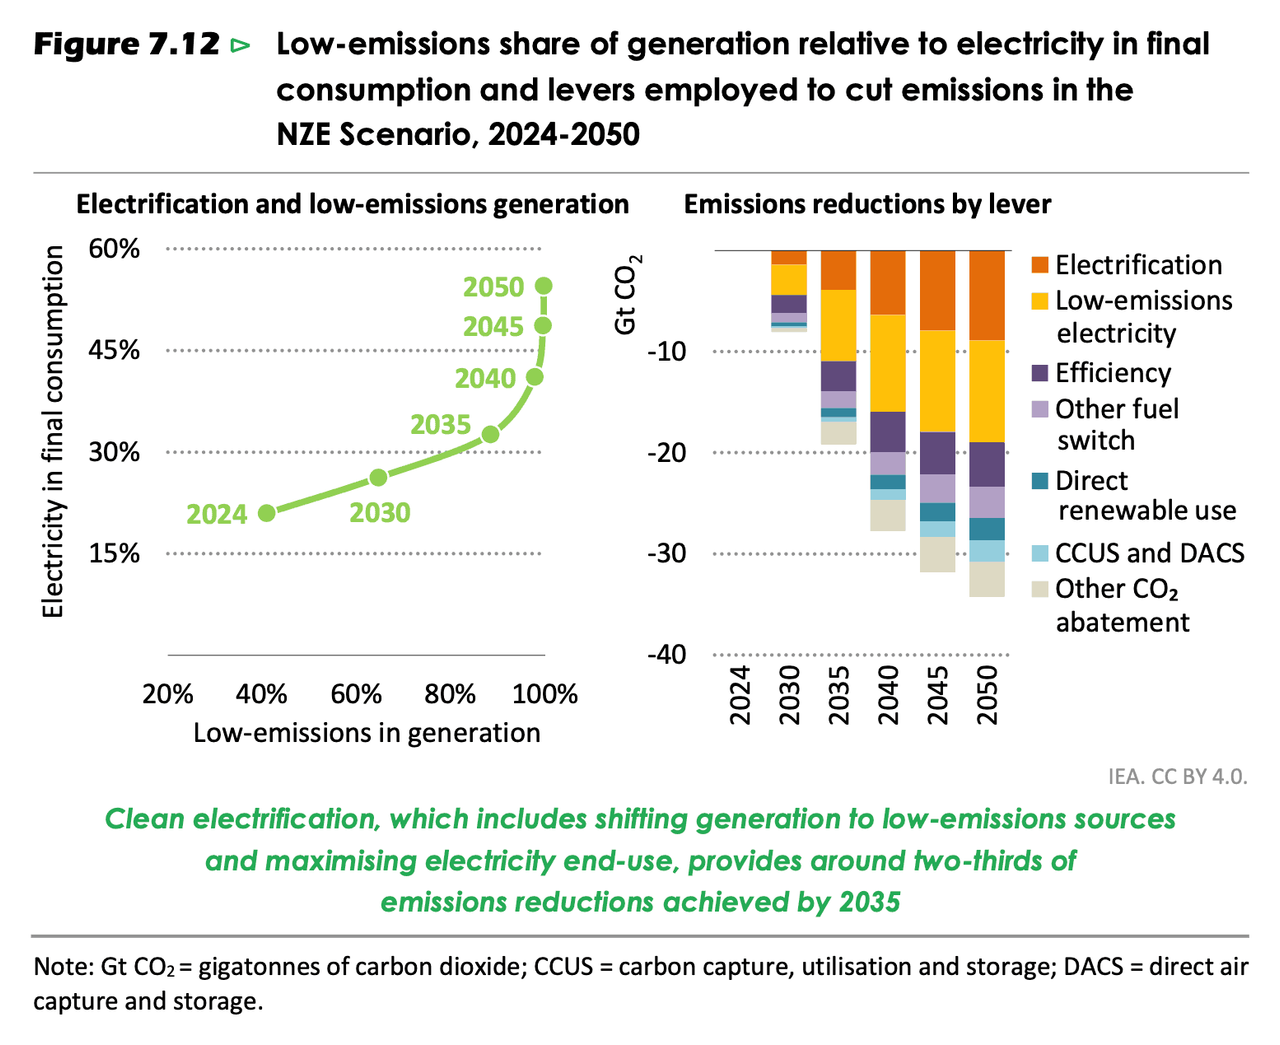
7.3.1 Clean electrification
Today, the power sector accounts for about 40% of global energy-related emissions. Shifting electricity generation to low-emissions sources and increasing the deployment of low-emissions electricity in existing and new end-uses are central to the NZE Scenario: these strategies give rise to around two-thirds of the emissions reductions to 2035 (Figure 7.12). In the NZE Scenario, low-emissions sources provide nearly all electricity generation by 2040, while electricity increases its share in total final consumption to around 40% by 2040 and 55% by 2050. The expanding role of electricity in total final consumption and the increase in electricity supply from variable renewable sources underline the importance of electricity security in the NZE Scenario.
Generating electricity with low-emissions sources
Low-emissions sources of electricity – renewables, nuclear, fossil fuels with CCUS, hydrogen and ammonia – accounted for just over 40% of global electricity generation in 2024, up from around 30% a decade ago. Renewables were responsible for 32% of power generation worldwide, and nuclear for around 9%: there was also a very small contribution of less than 0.003% from fossil fuels equipped with CCUS.
Global installed capacity of renewables triples to 2030 from a 2022 baseline in the NZE Scenario, building on the strong momentum already seen in the power sector, and meeting the goal set at COP28 in 2023 (Figure 7.13). As a result, renewables expand from around one-third of total generation today to around three-quarters by 2035. Achieving this while maintaining electricity security means ensuring that investment in electricity system flexibility keeps pace. Having surged by over 80% in 2024, the installed capacity of stationary batteries increases 17-fold to 2035, average of 30% per year, reaching almost 2 900 gigawatts (GW) in capacity terms and more than 8 400 gigawatt-hours (GWh) in energy terms. In the NZE Scenario, investment surges in grid infrastructure, and around 30 million kilometres (km) of new transmission and distribution lines are added by 2035.
As variable renewables such as solar PV and wind account for a rising share of generation, dispatchable capacity plays a critical role to ensure electricity security. Long lead-times for nuclear limits its role in the near term, but installed nuclear capacity in the NZE Scenario increases 70% by 2035 from the current level, and by 2050 it is two-and-a-half times higher. By the 2030s, the nuclear industry delivers annual additions of around 40 GW per year (Box 7.3). Hydropower capacity also expands strongly, with generation increasing more than 1.5-times by 2050. Unabated fossil fuel plants are operated increasingly for flexibility and capacity adequacy, and consequently their installed capacity falls more slowly than their output across the Outlook period. Fossil fuel plants equipped with CCUS and plants fired with hydrogen or ammonia are also deployed, providing additional low-emissions dispatchable capacity.
At the COP28 in December 2023, more than 20 countries, representing 70% of current installed nuclear capacity, pledged to triple global nuclear power capacity by 2050. Six additional countries signed the pledge at the COP29 in 2024. If fully realised, this commitment would increase global nuclear capacity from 413 GW in 2020 to 1 240 GW by mid-century, which would exceed the level in the NZE Scenario by 160 GW.
Reaching the tripling target by 2050 would require immediate efforts to scale up the nuclear industry in the 2020s to accelerate deployment in the 2030s and beyond, with annual deployment rates rising quickly in the 2030s to around 40 GW and being maintained throughout that decade and the 2040s. According to our analysis, this would lead to levels of global nuclear capacity additions never achieved before (Figure 7.14). This expansion would support a wide range of applications. Beyond its traditional role in the power sector, nuclear energy could contribute to water desalination and to low-emissions hydrogen production, for example. In the NZE Scenario, the pace of nuclear capacity additions is expected to slow after the mid-2030s, in line with other low-emissions technologies, as most electricity systems become largely decarbonised by then: as a result, capacity rises 2.5-times from the current level rather than tripling.
Achieving this tripling of nuclear capacity would require a significant increase in investment. Annual investment spending would need to rise from over USD 70 billion today to a peak of about USD 210 billion around 2035 before plateauing at around USD 160 billion through the 2040s. Investment would need to be on average 50% higher throughout the 2040s than in the NZE Scenario, resulting in an additional USD 900 billion of spending by 2050. This scaling up would be heavily dependent on robust supply chains, skilled labour and long-term policy support.
The United States could play a central role in this global effort. An Executive Order issued in May 2025 to reform the US Nuclear Regulatory Commission aims to revitalise the domestic nuclear industry and sets a goal of adding 300 GW of new capacity by 2050. It is reinforced by the One Big Beautiful Bill Act, which makes continued tax credits available to the nuclear industry. Countries in the European Union, Middle East, Africa, East Asia and North and Central America are also showing renewed interest in nuclear power as part of their decarbonisation strategies.
OKIsItJustMe
(22,504 posts)Excerpts in this reply are drawn from a Creative Commons source:
Table A.1b comes from the “Annex” which contains many tables:
This annex includes global historical and projected data by scenario for the following five datasets:
- A.1: World energy supply.
- A.2: World total final consumption.
- A.3: World electricity sector: gross electricity generation and electrical capacity.
- A.4: World CO₂ emissions: carbon dioxide (CO₂) emissions from fossil fuel combustion and industrial processes.
- A.5: World economic and activity indicators: selected economic and activity indicators.
Each dataset is given for the following scenarios: (a) Current Policies Scenario (CPS) [Tables A.1a. to A.5a]; (b) Stated Policies Scenario (STEPS) [Tables A.1b. to A.5b]; and (c) Net Zero Emissions by 2050 (NZE) Scenario [Tables A.1c. to A.5c].
It’s surprising you include the table at all, since it includes figures for years which are in the future. You generally refer to this as “soothsaying” (which is bad.) Strange, I thought one of the primary purposes of science was to make predictions… No worries though, these are not predictions, they are scenarios.
From the Executive Summary:
Scenarios
The World Energy Outlook 2025 (WEO-2025) has three main scenarios. Two of these set starting conditions and then examine where they lead – the Current Policies Scenario (CPS) and the Stated Policies Scenario (STEPS). A third, the Net Zero Emissions by 2050 (NZE) Scenario, maps out a pathway to achieve specific energy and climate-related goals.
- The Current Policies Scenario considers a snapshot of policies and regulations that are already in place and offers a cautious perspective on the speed at which new energy technologies are deployed and integrated into the energy system.
- The Stated Policies Scenario considers the application of a broader range of policies, including those that have been formally put forward but not yet adopted, as well as other official strategy documents that indicate the direction of travel. Barriers to the introduction of new technologies are lower than in the CPS, but the STEPS does not assume that aspirational targets are met.
- The Net Zero Emissions by 2050 Scenario takes a different approach, describing a pathway to reduce global energy-related carbon dioxide (CO₂) emissions to net zero by 2050, while recognising that each country will have its own route.
The continued rise of renewable energy
The pace varies, but renewables grow faster than any other major energy source in all scenarios, led by solar photovoltaics (PV). In the CPS, where they face stronger headwinds, renewables still meet the largest share of total energy demand growth, followed by natural gas and oil, even though annual solar PV additions in the power sector stall at around today’s levels of 540 GW to 2035. In the STEPS, policy changes mean that the United States has 30% less renewables capacity installed in 2035 than in last year’s Outlook, but at the global level renewables continue their rapid expansion. A boom in solar deployment is accompanied by robust growth across wind, hydropower, bioenergy, geothermal and other technologies, and by improvements in energy efficiency. China continues to be the largest market for renewables, accounting for 45-60% of global deployment over the next ten years across the scenarios, and remains the largest manufacturer of most renewable technologies.
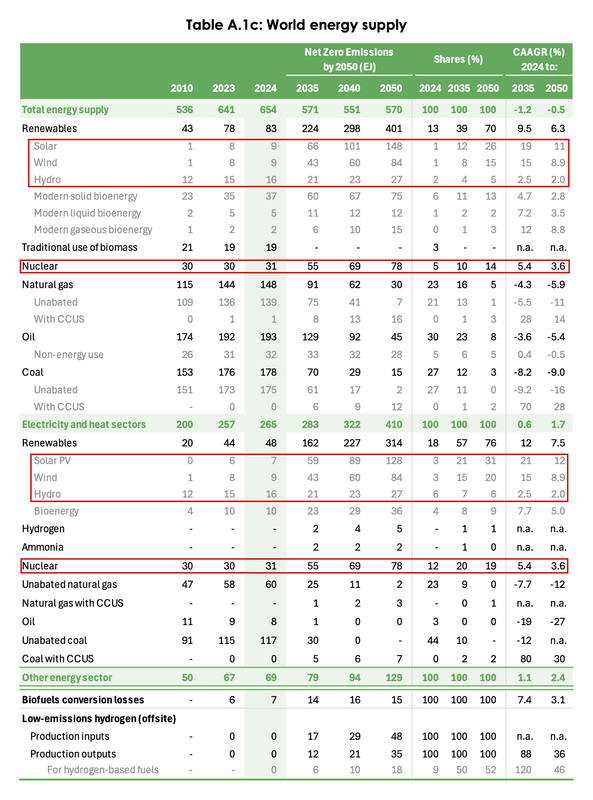
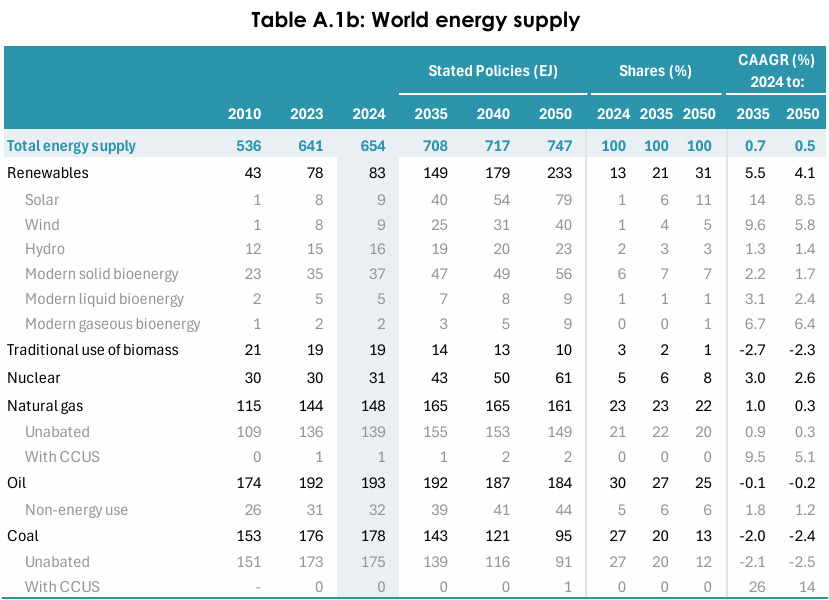
If you read the table, you should see that Solar, Wind & Hydro (combined) already produce more energy than “Nuclear.” Under the Net Zero Emissions by 2050 Scenario, by 2050, Wind by itself will provide more energy than nuclear, and solar will provide almost twice as much.
OKIsItJustMe
(22,504 posts)China is building several nuclear power plants. However, in the meantime, they’re essentially deploying renewable power plants faster than the rest of the world combined.
In 2025, 3 GW of new nuclear capacity came online, with China, India and Russia each completing work on a new reactor. However, these additions were offset by the retirement of 3 GW of nuclear capacity, two-thirds of which was in Belgium. In total, global nuclear capacity remained at 420 GW at the end of 2025, with reactors in operation in over 30 countries. There were ten construction starts in 2025 – nine in China and one in Russia – with a total capacity of 12.2 GW. Over the past decade, 94% of nuclear reactors that started construction were of Chinese or Russian design.
The capacity of nuclear reactors under construction is one of the highest levels seen in the last 30 years
Nuclear reactors with a combined capacity of 78 GW are currently under construction in 15 countries. Half of capacity under construction globally is in China, with total installed capacity in the country expected to reach 100 GW by around 2030. Among other emerging market and developing economies, Egypt, India and Türkiye each have around 5 GW under construction. In advanced economies, Japan, Korea and the United Kingdom each have two reactors under construction, while Slovakia has one; their combined capacity is 9.5 GW. Japan continues to restart reactors whose operations had been suspended.
Nearly all nuclear reactors currently under construction are large scale, most with capacities above 1 000 MW. At the same time, China already operates one land-based small modular reactor (SMR), and Russia a marine-based one. There is one 125 MW commercial SMR under construction in China and one with 300 MW of capacity in Russia. Additional SMRs are likely to begin construction in the near term in Canada, Korea, the United Kingdom and the United States.

thought crime
(1,866 posts)Newsflash: this is online social media, right here in river city.
And yes, China is constructing nuclear plants because they are using an all-of-the-above strategy to lower emissions and achieve energy independence. They are committing massively to renewable energy because nuclear energy, by itself, is too expensive and slow to achieve the climate goals alone. Everyone knows this. Well, almost everyone...