Environment & Energy
Related: About this forumChinese consumption of coal and renewable energy
Last edited Tue Sep 24, 2013, 12:25 PM - Edit history (2)
I started this as a comment in the US coal export thread, but I thought I'd re-post it as an OP, and add a bit more polemical gristle to it.
All the data in the following graphs is is from BP's Statistical Review 2013, and is current to the end of 2012. The vertical axis is in MTOE, "millions of tonnes of oil equivalent", a unit used to compare different energy sources. There are some underlying assumptions involved in converting between different energy sources, but it's broadly useful for comparing thermal energy sources.
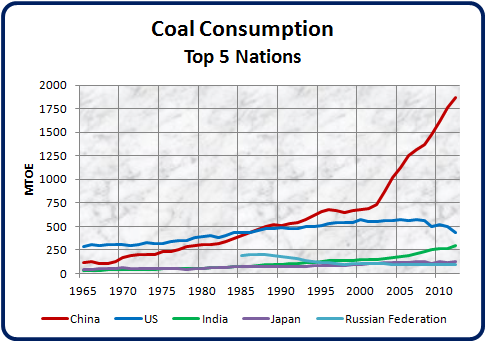
The first graph compares the performance of the world's current top 5 coal consumers :
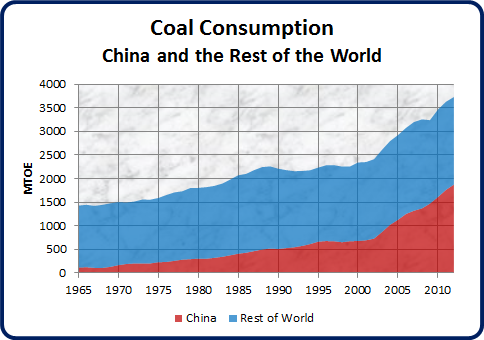
The next compares China's coal consumption to that of the rest of the world,

In 2012 China burned half of all the coal burned in the world.
The next shows China's coal consumption since 1965 as a proportion of the total world consumption:
The trend of China consuming more and more of the world's coal is showing no signs of slowing, despite their continued jawboning about reducing coal in favour of renewable energy.
Speaking of renewable energy, China's performance has not so far been commensurate with either their public statements or their need to stop burning coal:
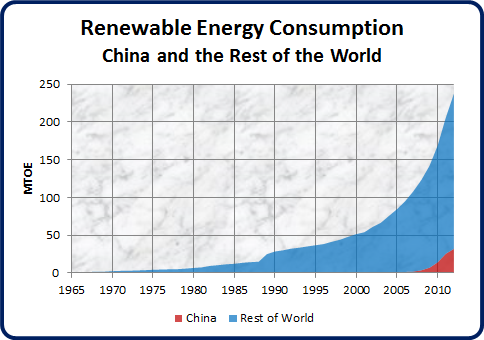
They'll have to to a lot better than that if they care about keeping the "Arctic methane bomb" from exploding and blowing civilization to hell.
The BP Statistical Review page is here: http://www.bp.com/en/global/corporate/about-bp/statistical-review-of-world-energy-2013.html and the Excel workbook with the data is here: http://www.bp.com/content/dam/bp/excel/Statistical-Review/statistical_review_of_world_energy_2013_workbook.xlsx
 = new reply since forum marked as read
Highlight:
NoneDon't highlight anything
5 newestHighlight 5 most recent replies
= new reply since forum marked as read
Highlight:
NoneDon't highlight anything
5 newestHighlight 5 most recent replies
OnlinePoker
(6,117 posts)A link to the source would be good as well. Thanks.
happyslug
(14,779 posts)MToE is a measurement of ENERGY within in a energy source (which can be coal, oil, peat, or even a battery). It is a way to compare ENERGY from various sources of energy as opposed to looking at each source based on its own energy content:
M=Million
toe_ tonne of oil equivalent
Thus
MToE= Million tonne of Oil Equivalent
http://en.wikipedia.org/wiki/Tonne_of_oil_equivalent
1 barrel of oil equivalent (boe) contains approximately 0.146 toe (i.e. there are approximately 6.841 boe in a toe).
1 t diesel = 1.01 toe
1 m3 diesel = 0.98 toe
1 t petrol = 1.05 toe
1 m3 petrol = 0.86 toe
1 t biodiesel = 0.86 toe
1 m3 biodiesel = 0.78 toe
1 t bioethanol = 0.64 toe
1m3 bioethanol = 0.51 toe[3]
1 MWh = 0.086 toe [4] (therefore 1 toe = 11630.0 kWh) [5]
at thermal power plant, 1 MWh generated with 0.22 toe fuel or 0.39 MWh with 0.086 toe[6] (39% thermal to electrical conversion efficiency)
I notice GliderGuider gave you the site for her data:
http://www.bp.com/en/global/corporate/about-bp/statistical-review-of-world-energy-2013.html
Another good source for data is the Energy Information Agency (EIA):
http://www.eia.gov/
A third source is the International Energy Agency:
http://www.iea.org/
Most energy consuming nations are member of the IEA, most energy EXPORTING nations are NOT.
quadrature
(2,049 posts)why is that?
happyslug
(14,779 posts)I suspect the reason Uranium was NOT on that list is we are talking about OIL equivalent. When it comes to Uranium you are running into two problems:
1. What is the equivalent of Uranium in terms of Oil? I kg of Uranium can produce as much electricity as 10,000 kg of oil or 14,000 kg of coal. There are 6-8 barrels per tonne, 1000 KG per ton. Thus 10,000 kg of oil equals 10 tonnes or about 60-80 barrels of oil. Thus a rough calculation would .01666 kg of uranium equals to one barrel of oil or 16 grams of Uranium equals one barrel of oil, or 1/2 ounce of Uranium equals one barrel of oil.
Barrels per tonne:
http://en.wikipedia.org/wiki/Barrel_(unit)
Grams to Ounces:
0.035274
Thus, 1 kg natural uranium - following a corresponding enrichment and used for power generation in light water reactors - corresponds to nearly 10,000 kg of mineral oil or 14,000 kg of coal and enables the generation of 45,000 kWh of electricity.
http://www.euronuclear.org/info/encyclopedia/f/fuelcomparison.htm
2. Relevancy. i.e. who cares how much uranium it takes to provide the same power of oil, no one is making a Uranium powered car, they are making oil, natural gas and even coal operated vehicles (in terms of coal it is more coal gasification then direct use of coal, but such vehicles have been made and used). The chief reason for this is you can NOT get a nuclear chain reaction with less the about
To "use" uranium to propel a vehicle, the uranium is used to produce electrical power, which is sent through electrical wires either to vehicle for direct use (Trains, Streetcars, trolly buses and in some cases trucks) or used to charge the battery in an electrical powered vehicle. Such vehicles are becoming more and more popular but if you take them out of the equation, you are left with the fossil fuels for transportation purposes where oil dominates today, challenged by natural gas, bio-diesel and other similar liquid fuels NOT uranium.
Remember you can NOT have a Chain reaction if you do NOT have enough Critical mass and the critical mass for U-235 is 52 Kg or about 123 pounds (U-233 critical mass is 15 KG). Thus you have a minimum size for nuclear plants. Please note the 52 kg is for almost 100% U-235, if the U-235 is only enriched to 20 % that weighs over 400 kg or 1100 pounds or over half a US ton.
http://en.wikipedia.org/wiki/Critical_mass
GliderGuider
(21,088 posts)MTOE means "millions of tonnes of oil equivalent", a unit used to compare different energy sources. There are some underlying assumptions involved in converting between different energy sources, but it's broadly useful for comparing thermal energy sources.
The BP Statistical Review page is here: http://www.bp.com/en/global/corporate/about-bp/statistical-review-of-world-energy-2013.html and the Excel workbook is here: http://www.bp.com/content/dam/bp/excel/Statistical-Review/statistical_review_of_world_energy_2013_workbook.xlsx
I'm updating the OP with this info as well.

FBaggins
(28,678 posts)Can't help you with the data source. GG often builds these graphs on his/her own.
GliderGuider
(21,088 posts)And "he" works just fine for me, last time I looked! 

kristopher
(29,798 posts)Actually you haven't included any substantive discussion that allows proper understanding of the comparison you supposedly are attempting.
Here is the part you elect to pretend doesn't exist:
Four Charts That Prove the Future of Clean Energy Is Arriving
“We are living it, and it is gaining force.”


Full article: http://www.greentechmedia.com/articles/read/four-charts-that-prove-the-future-of-clean-energy-has-arrived?utm_source=Daily&utm_medium=Headline&utm_campaign=GTMDaily
Observe in your charts that there was roughly a trebling of coal consumption in the past 10 years. The charts track consumption so we know that the decisions and policy actions that led to this trebling were another 10 years in the making. I mention this to show something you full well know - change requires time. Your pretense that no change is taking place isn't supported by the facts, and you are making a false claim when you say
"The trend of China consuming more and more of the world's coal is showing no signs of slowing, despite their continued jawboning about reducing coal in favour of renewable energy. Speaking of renewable energy, China's performance has not so far been commensurate with either their public statements or their need to stop burning coal"
In 2007 China - with the exception of solar hot water - had virtually no renewable energy installed, but they were enticed by the economic opportunities overseas and started fostering their domestic renewable energy manufacturing industries.
In 2008 they accomplished their first assessment of their renewable resource assets and when the results were released in early 2009 they found they had more than enough renewable potential to provide all of their needs if they chose to develop them.
They did. Previously they had followed the standard World Bank fossil fuel model for developing countries building out their energy infrastructure - they focused on coal and dabbled in nuclear.
After the assessment they started setting ambitious goals for their own use of renewable energy and routinely exceeded those goal by huge margins.
Concurrently they started pumping money into the solar manufacturing industry. In 2002 the US Dept of Energy had predicted that IF global PhotoVoltaic panel manufacturing capacity could hit 3 gigawatts annually by 2020 it would lead to price reductions in solar sufficient that the world would be well on its way to replacing fossil fuels for electricity.
The Chinese were far more ambitious and hit that target almost overnight on their way to building more than 10X.
Here is a recap of what that has resulted within China's domestic energy sector from the investment in lowering the manufacturing cost of solar:
PreMarch 2011 - PreFukushima the goal for installed solar PV was 5GW by 2015. "... installed solar power capacity at the end of 2010 was less than 1 GW"
Post March 2011 - Just after Fukushima they doubled that to 10GW by 2015.
Dec 15, 2011 – "...government has set a target for installed solar power generating capacity to reach 15 gigawatts by 2015..."
http://www.scientificamerican.com/article.cfm?id=china-scales-up-solar-power-50-percent
July 2012 - Raises goal to 21GW by 2015 (includes 1GW of CSP)
http://www.renewableenergyworld.com/rea/news/article/2012/07/china-quadruples-2015-solar-energy-target-to-aid-demand-prices
Oct 2012 - Rumors of goal being revised up to 40GW
Dec 2012 - Goal of 40GWby 2015 announced
http://cleantechnica.com/2012/12/13/chinas-new-solar-target-40-gw-by-2015-8-times-more-than-its-initial-5-gw-target/
Jan 2013 Expect 10GW of solar in 2013 along with huge amount of wind
http://www.renewableenergyworld.com/rea/news/article/2013/01/china-to-add-49-gw-of-renewables-in-2013-solar-stocks-soar
That is how the trajectory of the curves gets altered.
July 2012 this was the status of the top 5 country's solar installations:
2. Italy — 12.8 GW
3. Japan — 4.9 GW
4. Spain — 4.4 GW
5. USA — 4.4 GW In other words,
41 GW of solar power is really a big deal.
http://cleantechnica.com/2012/12/13/chinas-new-solar-target-40-gw-by-2015-8-times-more-than-its-initial-5-gw-target/
With the evidence of China's ability to expand an energy resource evident in both the development of coal and the more recent development of renewables, only a fool would doubt their ability to deliver on the goal of moving away from coal.
GliderGuider
(21,088 posts)I know these facts don't support your spin. I'm sorry, I wish they did.
ETA: There is just no sense of political or ecological urgency showing up in the Chinese consumption numbers.

CRH
(1,553 posts)If I read the post and the links correctly, China is moving on a target for 2015 that equals the 2012 output of solar generation for the top five counties. I would like to put that in perspective, as a percent of the total energy China consumed in 2012, so I can determine what kind of a dent they are making in replacing carbon with renewables. Where can I locate the total energy use in China in oil equivalent or other units. I can convert it to GWs from there. Thanks.
GliderGuider
(21,088 posts)Total: 2735.2 mtoe
Oil: 483.7 (17.7%)
Natural Gas: 129.5 (4.7%)
Coal: 1873.3 (68.5%)
Nuclear Energy: 22.0 (0.8%)
Hydro electric: 194.8 (7.1%)
Renewables:31.9 (1.2%)
King Coal indeed! But it is nice to see that renewables are 50% ahead of nuclear power.
BP's conversion factor is 12 terawatt-hours per mtoe (12 megawatt-hours per toe).
CRH
(1,553 posts)using some very loose assumptions, for solar generation, specifically the 40GW figure in cristophers' post. I assume the renewables includes wind, geothermal, biofuels as well. In GP's figures hydro has been put into its own category.
Anyway it appears some of my assumptions were a bit harsh. I'm still curious how a GW of solar generation is calculated in relation to system potential and effective hours per day of generation.
GliderGuider
(21,088 posts)So 40 GW of solar capacity is equivalent to about (40*0.15)=6 GW of full time generation. At 8760 hours per year, that's 52.6 terawatt-hours. Using BP's conversion factor of 12 terawatt-hours per mtoe, that 40 GW of solar will produce about 4 mtoe per year (0.16% of their 2012 primary energy consumption). Draw your own conclusions about how big a deal that will be...
CRH
(1,553 posts)everything in the OP graphs are in relation to coal use, without an indication of China's total energy consumption, MTOE or other.
CRH
(1,553 posts)I've tried to get figures from the BP site but my computer is old and the beach ball runs non stop. No answers there.
Found a graph from 2011 on TOE for China. The graph indicates a total of about 2.5 Billion TOE. Of that 1.75 Billion is coal. This converts to 2,500 MTOE and 1,750 MTOE.
A problem arises with the 40 GW figure because the figure is useless without a time frame. Is the production for an hour or a year. One assumes that is the production 'potential' for an hour. However without figures for how many hours per day the solar generation is effective and to what percent it is recoverable from the potential, how much actual power are we talking about?
Google indicates a GW of solar generation will supply about 200,000 homes, with consumption equal to US lifestyle. That is about 8,000,000 homes for 40GW, or about 30 - 40 million occupants with first world lifestyles.
So for total energy consumed by China in 2011, 40 GW would represent a small fraction of the total power used, residential, commercial, industrial, and transportation. If the average solar GW could be produced for four hours a day at the full potential, it would convert to (40GW x 1460 GWh/Yr = 58,400 GWh/Yr) of total solar production. This converts to 5,021,496 TOE per year of 5 MTOE.
So if these computations are correct using the loose figures from total energy used in China in 2011, 40 GW of solar production at full potential for 4 hours a day would generate about .2% of the total energy used, and .28% of 2011 coal use.
Where am I wrong?
kristopher
(29,798 posts)...asking the wrong questions.
Not sure why you would think the significance of the 40GW of solar to be installed within a couple of years lies in the amount of generation it produces relative to coal. The point was clear in my post - China built most of its coal capacity within a 20 year window, and they can do even better with renewables. The amount installed in 2013 alone is supposed to be 49GW of renewables, not counting solar hot water (which is very large in China)
The question is how long will it take before CARBON is phased out; to that end we look at solar, wind, biomass, biomethane, geothermal and all types of hydro.
Given the performance in growing their coal industry and the now low and going lower cost of renewables, there is no reason to think that the rate of growth curve for renewables will not be at least as aggressive as that of coal.
As an aside, you need to be careful of the units being discussed when comparing primary energy which is used when discussing thermal fuel sources (nuclear and fossil) with the output of renewables, which is discussed in terms of final consumption. The thermal sources only deliver about 28-35% of their primary energy content to the end user; the rest is discharged as (usually) wasted heat.
In summary, what we are concerned with is how to bend the curves, and the context associated with the graphs is essential to understanding how that happens.
GliderGuider
(21,088 posts)Given the performance in growing their coal industry and the now low and going lower cost of renewables, there is no reason to think that the rate of growth curve for renewables will not be at least as aggressive as that of coal.
In order to get a feel for that, let's look at China's build-out rate of carbon and non-carbon energy sectors. This graph shows the performance of both sectors over the last 12 years, since their big expansion began. The carbon line includes oil, gas and coal. The non-carbon line aggregates all renewables, hydro and nuclear power. Then the current trends are extrapolated out 6 years, based on these two assumptions of yours:
1. The growth curve of of renewables will be at least as aggressive as that for carbon energy. The curve chosen for renewables is a very aggressive 4th order polynomial, while the carbon trend shown is linear.
2. Change requires time. This implies that the policy decisions in place over the last 5 or ten years that are driving today's situation will remain in force for at least the next 6 years.
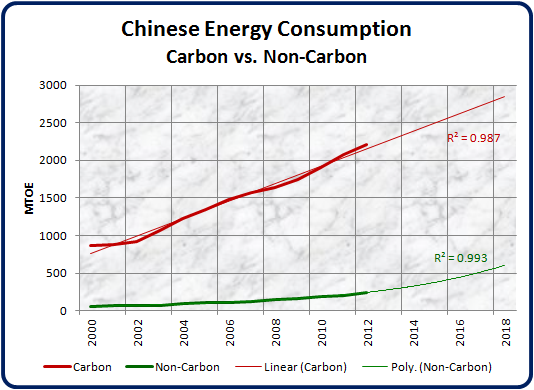
The 350 mtoe increase in renewables over the next 6 years represents the addition of between 2000 and 2500 GW of renewable capacity (with an average capacity factor of around 25% to factor in wind, hydro and solar).
Carbon-based energy, on the other hand, adds over 1000 mtoe in the same period - three times as much - under very pessimstic growth assumptions. (Note that as well as using a linear trend, I started in the year 2000, including the flat toe of the coal curve in the trend-line, thus flattening it further.)
So, based on your own assumptions, we may conclude that it will probably be longer than 6 years before current renewable build-out rates begin to take market share away from coal.
Of course, if China decides to sacrifice their own economic growth for the sake of the planet's climate by reducing their coal use, all bets are off. Let's pray that happens.
GliderGuider
(21,088 posts)Last edited Wed Sep 25, 2013, 11:59 AM - Edit history (2)
According to the Word Bank, China's economic growth in 2012 was 7.8%, for a GDP in constant $2005 dollars. This was down from a high of 14% in 2007. The average growth over the last decade has been about 10%.
They realized about $1650 of GDP per toe, a value that has been constant since 2009.
Let's assume the following:
- China's economic growth will average 7% pa over the next 6 years;
- that the energy productivity remains constant at $1650/toe;
- their build-out of renewables is as shown in the above graph, rising from 250 mtoe today to 600 mtoe in 2018; and
- Each marginal mtoe of renewables avoids 2 mtoe of carbon energy consumption.
Looking out to 2025, with the same assumptions about growth in GDP and renewables, and the same marginal substitution rate of 1:2, we get this outcome:
GDP has more than doubled, from $4.5 trillion to almost $11 trillion in constant 2005 US dollars.
Renewable energy consumption has increased by a factor of 7, from 250 mtoe today to 1800 mtoe in 2018.
Carbon energy consumption has increased by 31%, to 3250 mtoe.
CO2 production has increased to about 12 GT/year.
Based on this, my bet is that we will not see China reduce their carbon emissions until after 2030, when the reductions will begin from a level much higher than today.
By that point, atmospheric CO2 levels will probably be breaking through 430 ppmv and still climbing.
It's not a pretty picture, and doesn't make me feel confident in the slightest. A lot depends on how close to reality the assumptions turn out to be. They could just as easily be wrong on either the optimistic or the pessimistic side.
Do you believe China will be able to do better than that?

cprise
(8,445 posts)The Chinese are feeling the brunt of environmental degradation, its the top cause of social unrest over the last decade, and they have proposals for implementing BOTH a carbon tax and cap-and-trade system in tandem--in the short term.
Some of their other environmental problems cannot be de-linked from high coal consumption.
Add to this picture the fact that they are one of the few societies whose leaders are not wed to the idea of perpetual economic growth (e.g. this is a capitalist phase they are going through).
That coal trend line is going to start sagging earlier than you think...
Nihil
(13,508 posts)> they are one of the few societies whose leaders are not wed to the idea of
> perpetual economic growth (e.g. this is a capitalist phase they are going through).
Given that the rest of the world's "capitalist phase" hasn't ended after a couple
of hundred years and China's has continued across successive leadership
changes, I don't take a lot of comfort in your comment.

cprise
(8,445 posts)GliderGuider
(21,088 posts)If anything, China's behavior is more, not less, egregious than that of the rest of the world. They can say whatever they wish. Their actions speak the truth.
cprise
(8,445 posts)The Chinese are at once new to environmentalism and in dire need of it. They've also proven they can take bold steps in the right direction.
Look again in 5 years...

NickB79
(20,296 posts)On the one hand, you say the ruling party is being forced by societal pressures to reduce their air pollution.
On the other, you say they aren't wed to the idea of perpetual economic growth.
That makes no sense. If China ever entered a recession (the worst-case scenario of a disregard for economic growth), and there were literally hundreds of millions of Chinese without work, it would make the current unrest over smoggy air look like a festival.
With the prospect of a middle class so close and tempting to hundreds of millions of Chinese, having it taken away from them at this point would likely result in a damn civil war.
And even if the coal trend line starts sinking earlier than expected, it's gotten so HIGH already that there is no conceivable way to shrink it fast enough to stay within global carbon targets.
cprise
(8,445 posts)And the hypothetical case you make is not only presumptuous (they "would" do this, they "would" do that--with no connection to history or current events), it trivializes the environmental problems the Chinese face.
If the Chinese can plan their way off of a high growth trend then more power to them.
kristopher
(29,798 posts)The lead time to the build up of coal had to be at least 10 years.
The start time for renewables is at the earliest 2007.
Your "projection" is, on its face therefore, comparing apples and oranges.
It is also invalid in that the scale of endeavor between the two is wildly different. The investor base to build local community wind farms or rooftop solar is vastly larger than the investor base available to build fossil plants - most of the renewable generation in Germany, for example, is locally owned.
Does it give you some sort of sick kick to deliberately misinform people?
GliderGuider
(21,088 posts)
GliderGuider
(21,088 posts)it looks as though China has been averaging roughly 1 GW of new generating capacity every 10 days for the past 10 years...virtually all of it coal-powered.