2016 Postmortem
Related: About this forumIRS Income Data on US Households
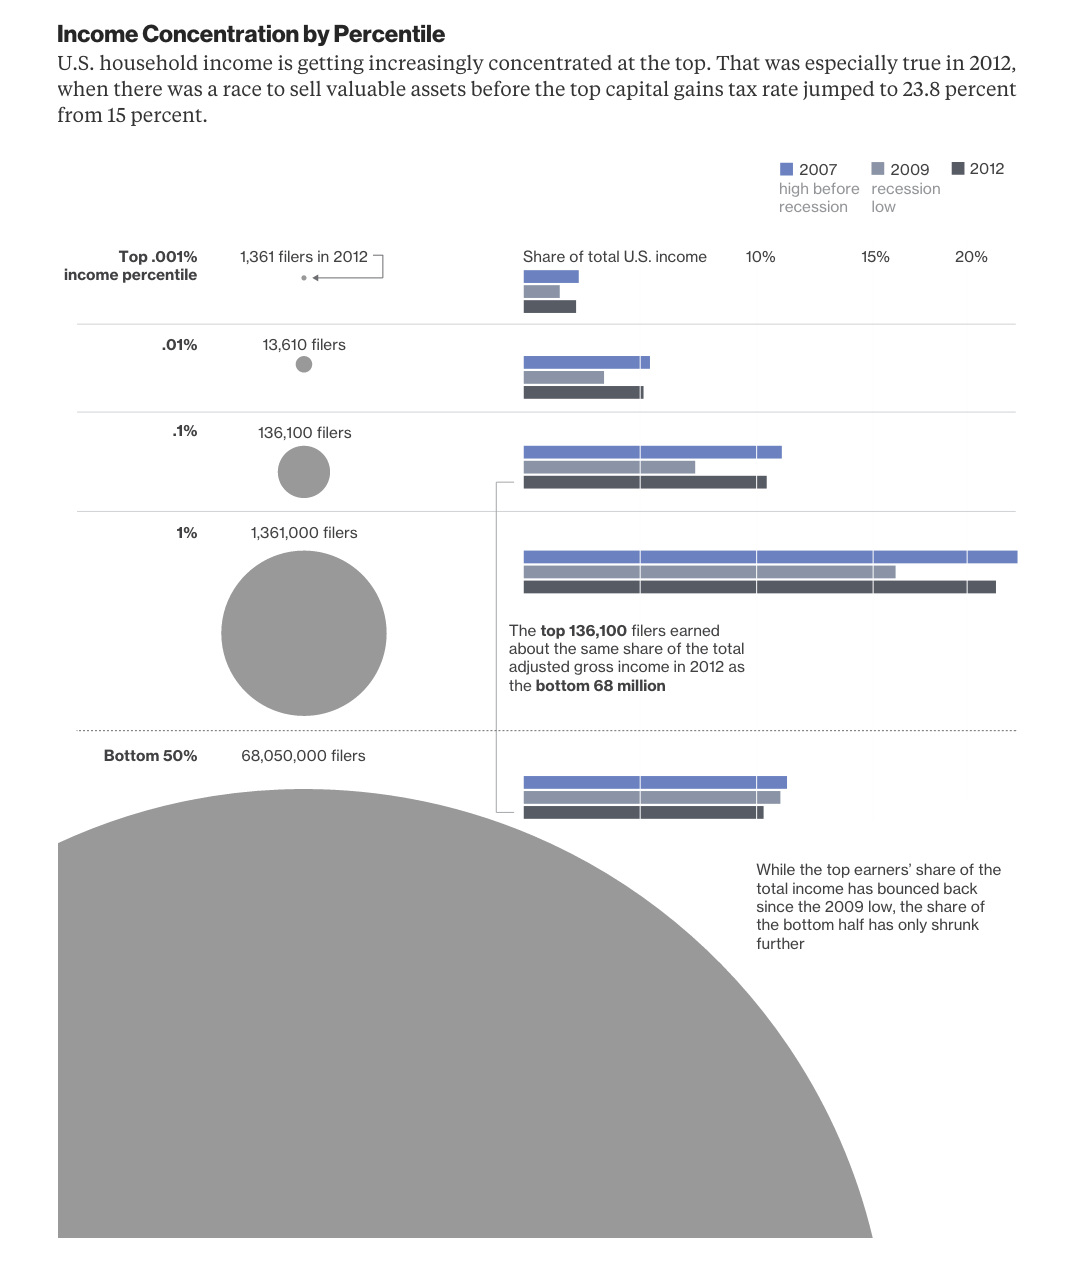
http://www.ritholtz.com/blog/2015/06/irs-income-data-on-us-households/
So for about 4 million people at the top, voting for a continuation of what we have seems like a no trainer. Unless they don't like all that dirty money they keep grasping for.
The other 68 million might want to check here: https://berniesanders.com/
There is another way.
 = new reply since forum marked as read
Highlight:
NoneDon't highlight anything
5 newestHighlight 5 most recent replies
= new reply since forum marked as read
Highlight:
NoneDon't highlight anything
5 newestHighlight 5 most recent replies

Igel
(35,323 posts)I mean, that chart shows everybody's percentage is down. If there's still 100%, how can every group's percentage total less than 100%?
Oh. Because that non-top 48.98% isn't included in the chart. If everybody else's percentage is down--the top 0.01, the top 0.1, the top 1, and the bottom 50%, that means that missing chunk of percentage has to be in what's left. That would show they got something like 4 or 5% percentage points more than before. Apparently that's information that really shouldn't be highlighted.
One of the education standards for high school science in the backwards state of Texas is "Utilize skepticism, logic, and professional ethics in science," which often has a set of examples along with it. One example is to recognize when graphs and presentations are misleading because of misleading labels on the graphs and charts and incomplete information. There's a lot of that.
That not-quite-top 49% group is doing better than the rest in terms of percentage of the pie. Now, perhaps that "group" doesn't form anything like a natural class and some subgroups did much better and others did much worse. No matter. Not my grouping, not my argument.
Another example for that particular education standard is to beware mixing percentages and absolute numbers to manipulate the reader. Strictly speaking, the lower 50% could have increased their income over 2007, just not as much as that upper 49%. Or perhaps everybody lost income from 2007 to 2012 while the upper 49% held steady. There's a big difference between these, but the easy and quick takeaway is that the lower 50% lost income. I'm making no claim either way, except to say that this chart to make an emotional point leaves out something that's really important to making a non-emotional point.
Buried a bit is also the idea that the 2012 numbers for the upper percentages may be the result of a one-time event.
I'm sure some numbers must support the OP's argument. Some numbers. Somewhere.
jtuck004
(15,882 posts)by design (according to Stress Test by Timothy "Killer" Geithner) and that's no big problem in your estimation.
Wow, that display of adding and subtracting was impressive.
Like I said - when you have friends like you, what's the point? 
Enjoy yourself.