Welcome to DU! The truly grassroots left-of-center political community where regular people, not algorithms, drive the discussions and set the standards. Join the community: Create a free account Support DU (and get rid of ads!): Become a Star Member Latest Breaking News General Discussion The DU Lounge All Forums Issue Forums Culture Forums Alliance Forums Region Forums Support Forums Help & Search

progree

(10,989 posts)
21. I'm showing graphs in #4 that include food and energy (the regular headline numbers) and the ones without it (core)
Wed Apr 10, 2024, 03:52 PM
Apr 10

So people can take their pick. Both unfortunately show a considerable upturn in inflation in 2024 so far (with the core number showing a rise since August 2023)

On a 12 months basis the core CPI (without energy and food) is up 3.8%, while the CPI is up 3.5%.

The latest 3 month average increase for the core CPI is 4.5% while for the CPI it is 4.6% (both numbers annualized). ETA: And the increase in March was the same 0.4% for both measures (actual not annualized).

Anyway, neither the Fed nor any economists that I've ever heard of say that the core is the better indicator for past or present inflation. Our living standards are much better reflected by the regular one than the core one (the core measure is irrelevant for that purpose).

What they are saying that as a basis for projecting FUTURE inflation, the core is the better measure to use for that. I agree with them and you don't and that's fine. People are free to assume that because energy (which bounces wildly up and down and up and down and -- since mid-December -- sharply up) is going to keep increasing at this rate indefinitely. I'm free to assume that too, but I don't.

If there was a way to forecast energy prices into the future -- that has a reasonably good track record -- then the Fed should be using that and including it. But apparently there isn't one that I've heard of.

Anyway, whether we like it or not, valid or not, the Fed adjusts interest rates based on projections based on core inflation. As an investor concerned about interest rates, I have to live with that reality.

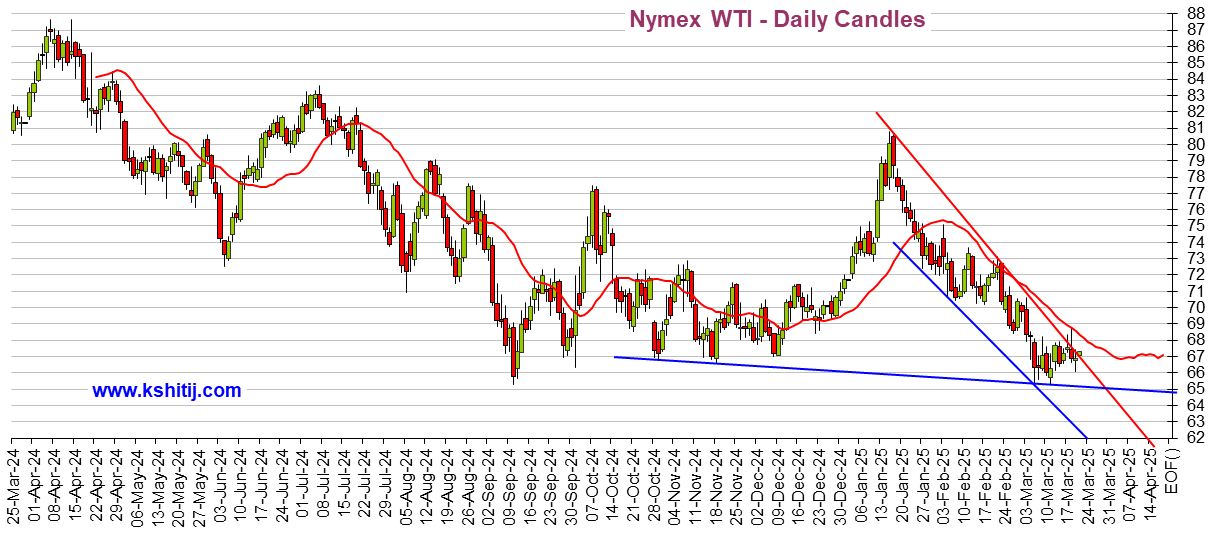
I wish I had a 12 month graph on energy or oil prices handy, to match my 12 month graphs on inflation, but I don't. I have this 6 month graph -- that is posted every market day in Stock Market Watch in the Economy Group -- example: https://www.democraticunderground.com/111697799


Flipped the stock futures from green to red NewHendoLib Apr 10 #1
The Federal Reserve needs to jack up interest rates some more. James48 Apr 10 #2
Disagree Johnny2X2X Apr 10 #5
Fed is too weak and too late to the inflation fight, as usual, as per the 1970s bucolic_frolic Apr 10 #3
Graphs: *CORE* CPI month by month and rolling 3 month average. EDIT: and regular CPI. And PCE core and regular progree Apr 10 #4
Thanks and good morning! BumRushDaShow Apr 10 #6
I've been hearing that since about September 2022 -- a year and a half ago -- progree Apr 10 #9
They have been "predicting" although I did see articles where there are some small drops BumRushDaShow Apr 10 #10
It was back in September 2022 and many times I've looked at the news since all these many months progree Apr 10 #12
AND BumRushDaShow Apr 10 #13
Fed weighs PCE even more Johnny2X2X Apr 10 #8
I added PCE and Core PCE to my assemblage of graphs in my #4 above progree Apr 10 #18
On average. Igel Apr 11 #29
Actually Johnny2X2X Apr 11 #31
Well, any such thing should DAMNED well include energy The Mouth Apr 10 #19
I'm showing graphs in #4 that include food and energy (the regular headline numbers) and the ones without it (core) progree Apr 10 #21
Thanks The Mouth Apr 11 #24
And thank you. I hate inflation too -- I was a young adult in the late 70's early 80's great inflation progree Apr 11 #25
I watched it wipe out my family's savings and future The Mouth Apr 11 #27
The business media and the GQP want us to crap our pants moniss Apr 10 #7
They are trying to equate "3.5%" being as bad as "9%" BumRushDaShow Apr 10 #11
I'm surprised it was that low hueymahl Apr 10 #14
I believe that's because what we feel is cumulative as opposed to a discrete point. When I buy groceries, my natural 24601 Apr 10 #17
In your example above, a 32% price increase over 3 years would indicate higher than reported inflation in 1/3 years SpicyBoi Apr 10 #22
We all have our own benchmark items we pay attention to. For some it's milk & eggs. For others, it's a gallon of gas. 24601 Apr 10 #23
In my world it's GASOLINE and ELECTRICITY The Mouth Apr 11 #28
The economy isn't that bad if people keep buying stuff IronLionZion Apr 10 #15
Nope. Igel Apr 11 #30
Costco style bulk purchasing is very American IronLionZion Apr 11 #32
Looking at CNBC.... Turbineguy Apr 10 #16
Email 'Mistake' on Inflation Data Prompts Questions on What Is Shared mahatmakanejeeves Apr 10 #20
Laissez-Faire Marthe48 Apr 11 #26
Latest Discussions»Latest Breaking News»Consumer prices rose 3.5%...»Reply #21