Welcome to DU!
The truly grassroots left-of-center political community where regular people, not algorithms, drive the discussions and set the standards.
Join the community:
Create a free account
Support DU (and get rid of ads!):
Become a Star Member
Latest Breaking News
General Discussion
The DU Lounge
All Forums
Issue Forums
Culture Forums
Alliance Forums
Region Forums
Support Forums
Help & Search
Economy
In reply to the discussion: STOCK MARKET WATCH -- Wednesday, 26 August 2015 [View all]Demeter
(85,373 posts)13. "BLACK" MONDAY SUMMARY REPORT
The World’s Richest People Lost Another $124 Billion on Monday
http://www.bloomberg.com/news/articles/2015-08-24/the-world-s-richest-people-lost-another-124-billion-on-monday
The global rout continues...VIDEO AT LINK LISTS NAMES AND AMOUNTS
Another $124 billion was wiped off the collective fortunes of the world’s 400 richest people today as the global selloff pushed the Standard & Poor’s 500 Index into its first correction in nearly four years.
Twenty-four billionaires saw their wealth fall by more than ten figures on Monday, including Bill Gates who dropped $3.2 billion and Jeff Bezos, who fell $2.6 billion, according to data compiled by the Bloomberg Billionaires Index. Mexico's Carlos Slim lost $1.6 billion as his fortune fell to its lowest level since the Index began in 2012.
Sliding markets worldwide have resulted in Chinese shares sinking the most since 2007, Germany's DAX falling into a bear market, and commodities reaching a 16-year low, as Brent crude plunged below $45 a barrel.
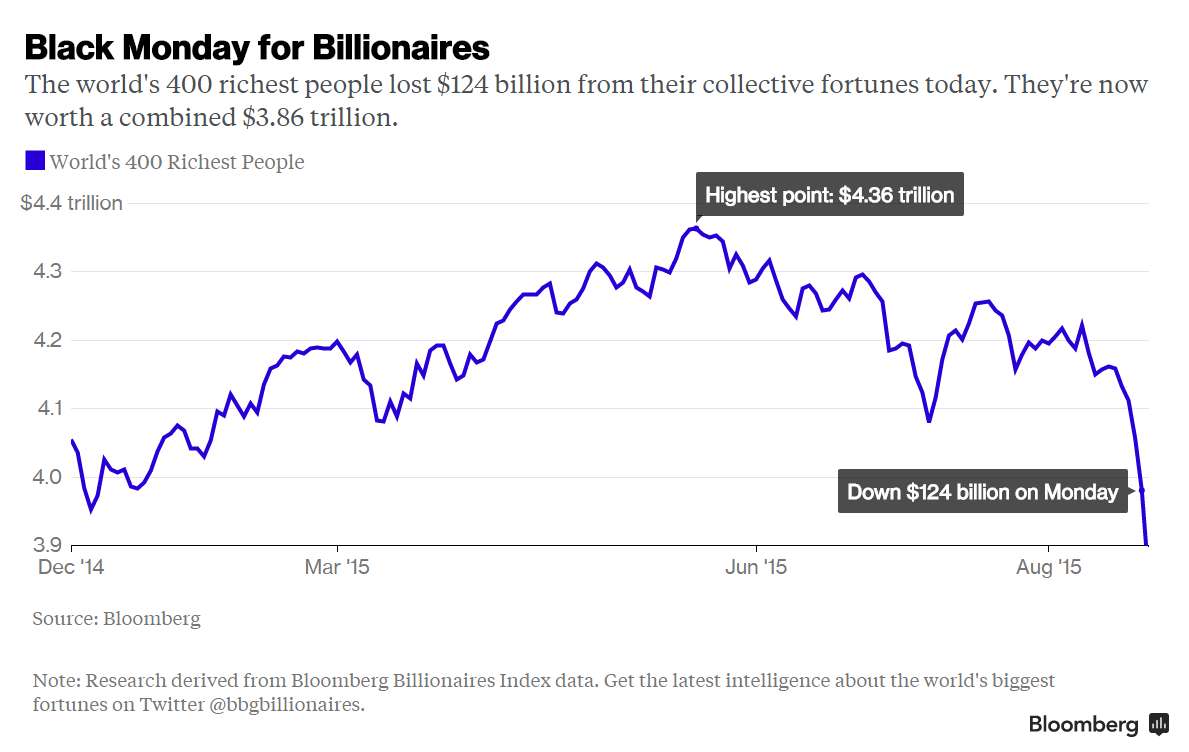
Last week’s declines had already seen the world’s 400 richest people lose $182 billion. A decline of $76 billion on Friday had put their fortunes into the red for the year-to-date.
The Bloomberg Billionaires Index takes measure of the world’s wealthiest people based on market and economic changes and Bloomberg News reporting. Each net-worth figure is updated every business day at 5:30 p.m. in New York and listed in U.S. dollars.
http://www.bloomberg.com/news/articles/2015-08-24/the-world-s-richest-people-lost-another-124-billion-on-monday
The global rout continues...VIDEO AT LINK LISTS NAMES AND AMOUNTS
Another $124 billion was wiped off the collective fortunes of the world’s 400 richest people today as the global selloff pushed the Standard & Poor’s 500 Index into its first correction in nearly four years.
Twenty-four billionaires saw their wealth fall by more than ten figures on Monday, including Bill Gates who dropped $3.2 billion and Jeff Bezos, who fell $2.6 billion, according to data compiled by the Bloomberg Billionaires Index. Mexico's Carlos Slim lost $1.6 billion as his fortune fell to its lowest level since the Index began in 2012.
Sliding markets worldwide have resulted in Chinese shares sinking the most since 2007, Germany's DAX falling into a bear market, and commodities reaching a 16-year low, as Brent crude plunged below $45 a barrel.
Last week’s declines had already seen the world’s 400 richest people lose $182 billion. A decline of $76 billion on Friday had put their fortunes into the red for the year-to-date.
The Bloomberg Billionaires Index takes measure of the world’s wealthiest people based on market and economic changes and Bloomberg News reporting. Each net-worth figure is updated every business day at 5:30 p.m. in New York and listed in U.S. dollars.
China Anxiety Resurfaces to Torpedo Relief Rally in U.S. Stocks
http://www.bloomberg.com/news/articles/2015-08-25/s-p-500-futures-rally-3-after-worst-2-day-selloff-since-2008
Why Did the Market Rally Evaporate in the Final Hour? VIDEO DISCUSSION AT LINK
A rebound that took the Dow Jones Industrial Average up more than 440 points disappeared in the final hours of trading, with investors giving in to trepidation over what will happen overnight in China amid the most volatile equity markets in four years.
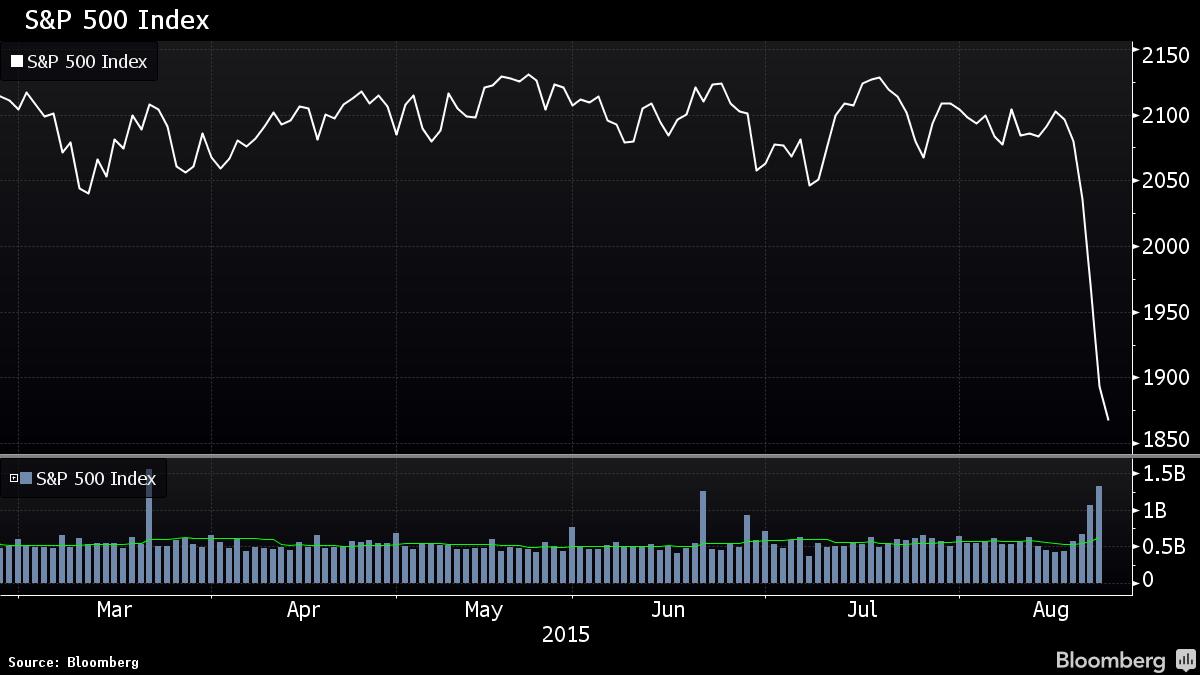
The 30-stock gauge ended down 204.91 points, or 1.3 percent, at 15,666.44 at 4:09 p.m. in New York, and 4 percent below its session high. The peak-to-trough retreat exceeded the loss at Monday’s close, when concern about global growth ignited the worst decline for U.S. shares in four years. The Standard & Poor’s 500 Index went from up 2.9 percent to down 1.4 percent, closing at 1,867.61 as most of the selling occurred after 2 p.m.
“People are nervous about the potential volatility that could erupt or resurface in the market,” said Stephen Carl, principal and head equity trader at Williams Capital Group LP. “They’re not sure what’s going to happen overseas, and that uncertainty is winning out.”
The unwinding disappointed bulls who earlier in the day staked hopes on China’s efforts to inject stimulus into its economy. The central bank today cut interest rates for the fifth time since November and lowered the amount of cash banks must set aside in an attempt to stem the country’s biggest stock market rout since 1996 and a deepening economic slowdown. More than $2 trillion has been erased from American equity values since last Wednesday, breaking a calm in a stock market that before this week had gone almost four years without a 10 percent correction....MORE
Citi: The Fed Will Still Hike in September, But There's One Big Wild Card Ahead
http://www.bloomberg.com/news/articles/2015-08-25/citi-the-fed-will-still-hike-in-september-but-there-s-one-big-wild-card-ahead
THE ARTICLE THAT KILLED THE RALLY
Pay close attention to Fischer--Citi is sticking with its call that the Federal Reserve will hike its policy rate next month. The bank's economists, led by William Lee, interpreted the Federal Reserve's July minutes differently from other institutions, claiming that monetary policymakers' increased concerns about financial stability cemented the case for a hike in September. Others institutions have recently pushed back their estimated dates for liftoff in light of international developments and volatility in financial markets emanating from China's decision to devalue the yuan.
Federal funds futures rates imply that the probability of a rate hike has slipped below 30 percent, down substantially from roughly 50 percent last week. So what could move Citi off its September call? China could theoretically serve as a "bunker buster" - but for now, it doesn't look like a big enough deal. However, Fed Vice Chair Stanley Fischer's appearance at the forthcoming Jackson Hole economic policy symposium is the "key wild card," says Lee.
"If he shows signs of worrying that the transitory downward pressures (commodity and energy prices and the appreciating dollar) are feeding through and becoming entrenched in wages and domestic prices—THAT would be a big event," the economist writes. "His concern would suggest reduced confidence in reaching the Fed inflation target in the medium term."
Insiders Pushed Up Stock Purchases Heading Into S&P 500 Selloff
http://www.bloomberg.com/news/articles/2015-08-25/insiders-pushed-up-stock-purchases-heading-into-s-p-500-selloff
One set of investors who weren’t shy about diving into the stock market in the runup to the current selloff was corporate insiders.
A total of 1,341 officers and directors of American companies purchased their own stock this month while 2,013 sold, according to data compiled by Washington Service and Bloomberg. The ratio of buyers to sellers is poised to reach the highest level since 2011 after more than doubling since April.
The actions aren’t looking very well timed at the moment with the Standard & Poor’s 500 Index sitting more than 6 percent below its average price in August. Still, the buying was at least a vote of confidence in a bull market whose durability has been called into question amid signs of global slowdown and the end of Federal Reserve stimulus.
“Maybe the executives recognize a correction can happen, but they believe in their business enough in terms of longer term to just go ahead and buy in front of it,” said Charles Smith, chief investment officer at Fort Pitt Capital Group Inc. in Pittsburgh, which oversees about $1.8 billion. “That’s bullish.”
OR MAYBE THEY'VE BEEN DRINKING THE KOOLAID....MORE
Just How Sick Is the Stock Market? BY Barry Ritholtz
http://www.bloombergview.com/articles/2015-08-24/how-serious-is-the-stock-market-s-decline-
China's markets set the tone for the day (and perhaps the week) with an 8.5 percent blood-letting. Global stocks followed suit, which came after last week's 5 percent tumble. Rather than tell you that markets are oversold -- you already know that anyway, and oversold markets can become even more oversold -- I want to bring a few interesting data points to your attention...Let's begin with China's markets. That is where much of the turmoil seems to be originating. A little context will go a long way.
One year ago, the Shanghai Stock Exchange Composite Index stood at 2209.46; it's now 3209.91. It closed last year at 3234.67, and peaked this year at 5166.35. To put those returns into percentages:
It is amazing that China is little changed for the year, down less than 1 percent. That gives you some idea of how absurdly inflated its markets had become in a very short time. Its easy money policies and encouragement of middle-class stock speculation (Why does that sound so familiar?) inflated a market boom that (Surprise!) is now unwinding. What those number show is quite telling.
Next, let's move to U.S. The chart below is courtesy of my colleague Josh Brown. It looks at the 5 percent, 10 percent and 20 percent declines in the Standard & Poor's 500 Index since its inception in 1957. There are several fascinating aspects to this data series.
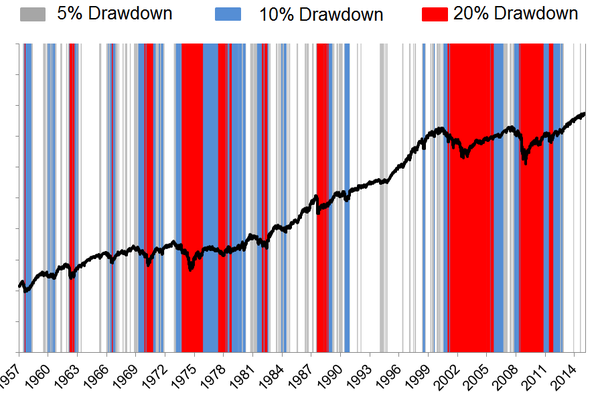
S&P 500 1957 to present drawdowns
Source: The Reformed Broker
First, let's start with the data: From all-time highs, we have seen 48 drawdowns of at least 5 percent. Of that group, a little more than a third of those became a full correction of 10 percent. (That's 17 of the 48, or 35 percent). Of all declines of 5 percent or more, less than one fifth (9 of the 48, or almost 19 percent) became drawdowns of 20 percent or more, the informal definition of a bear market.
If you had to break this 58-year period into market cycles, it is fairly easy to find the secular bull and bear markets just going by the colors. The post-World War II bull market has little of the blue or red corrections, right up until 1968-69 or so. Then we see the colorful period of 1968-1982, a brutal 16-year bear market. That is followed by the bull run from 1982 to 2000, with little in the way of blue or red. From 2000 to 2013, the wide swatch of red tells you that was a bear market. But since then we appear to be in a bull cycle. Charts such as this make it relatively easy to spot cycles visually. Indeed, this is consistent with what we know about secular bear markets, which tend to be characterized by frequent sharp rallies and severe sell offs.*
Ben Carlson (using Ed Yardeni's data) looks at this data somewhat differently. He observes that the average number of double-digit drawdowns has generally been lower each decade since the 1930s. It's noteworthy that the average double-digit decline of the 2000s was even worse than the 1930s, at least in terms of intensity.

Carlson notes how the recency effect leads investors to focus on the wrong things: "Stocks are up over 200% since March of 2009. Instead of celebrating those gains, investors are constantly worried about missing the next 5-10% correction."
Finally, let's put into broader context the frequency of corrections. U.S. markets average one 10 percent correction every 20 months. On average, we should expect these declines to take 71 trading days to play out (about three months).
As discussed above, these occur more frequently during secular bear markets. In the postwar period, one quarter of these occurred during the 1970s and another fifth of them occurred during the 2000s -- both periods were part of a secular bear market.
Note that in the secular bull market that began 1982, there was but one 10 percent correction in the first five years (1982 through the 1987 crash). After the 1987 crash through the March 2000 peak, there were just two corrections of that magnitude, according to Yardeni. As we noted last week, the economy seems to be OK, so this looks more like a correction than anything more serious, but that's just a guess on my part. We should know before the December Federal Open Market Committee meeting.
* For the purposes of our discussion, I am using 10 percent for a "correction," 20 percent for "bear market," and 30 percent for "crash," and 50 percent for "generational crash." These terms are random fabrications with no real meaning other than reflecting our base-10 numeric system.
http://www.bloombergview.com/articles/2015-08-24/how-serious-is-the-stock-market-s-decline-
China's markets set the tone for the day (and perhaps the week) with an 8.5 percent blood-letting. Global stocks followed suit, which came after last week's 5 percent tumble. Rather than tell you that markets are oversold -- you already know that anyway, and oversold markets can become even more oversold -- I want to bring a few interesting data points to your attention...Let's begin with China's markets. That is where much of the turmoil seems to be originating. A little context will go a long way.
One year ago, the Shanghai Stock Exchange Composite Index stood at 2209.46; it's now 3209.91. It closed last year at 3234.67, and peaked this year at 5166.35. To put those returns into percentages:
One year: +45.28 percent
Year to date: -0.77 percent
Year to date peak: +60.95 percent
Peak to trough: -37.87 percent
It is amazing that China is little changed for the year, down less than 1 percent. That gives you some idea of how absurdly inflated its markets had become in a very short time. Its easy money policies and encouragement of middle-class stock speculation (Why does that sound so familiar?) inflated a market boom that (Surprise!) is now unwinding. What those number show is quite telling.
Next, let's move to U.S. The chart below is courtesy of my colleague Josh Brown. It looks at the 5 percent, 10 percent and 20 percent declines in the Standard & Poor's 500 Index since its inception in 1957. There are several fascinating aspects to this data series.
S&P 500 1957 to present drawdowns
Source: The Reformed Broker
First, let's start with the data: From all-time highs, we have seen 48 drawdowns of at least 5 percent. Of that group, a little more than a third of those became a full correction of 10 percent. (That's 17 of the 48, or 35 percent). Of all declines of 5 percent or more, less than one fifth (9 of the 48, or almost 19 percent) became drawdowns of 20 percent or more, the informal definition of a bear market.
If you had to break this 58-year period into market cycles, it is fairly easy to find the secular bull and bear markets just going by the colors. The post-World War II bull market has little of the blue or red corrections, right up until 1968-69 or so. Then we see the colorful period of 1968-1982, a brutal 16-year bear market. That is followed by the bull run from 1982 to 2000, with little in the way of blue or red. From 2000 to 2013, the wide swatch of red tells you that was a bear market. But since then we appear to be in a bull cycle. Charts such as this make it relatively easy to spot cycles visually. Indeed, this is consistent with what we know about secular bear markets, which tend to be characterized by frequent sharp rallies and severe sell offs.*
Ben Carlson (using Ed Yardeni's data) looks at this data somewhat differently. He observes that the average number of double-digit drawdowns has generally been lower each decade since the 1930s. It's noteworthy that the average double-digit decline of the 2000s was even worse than the 1930s, at least in terms of intensity.
Carlson notes how the recency effect leads investors to focus on the wrong things: "Stocks are up over 200% since March of 2009. Instead of celebrating those gains, investors are constantly worried about missing the next 5-10% correction."
Finally, let's put into broader context the frequency of corrections. U.S. markets average one 10 percent correction every 20 months. On average, we should expect these declines to take 71 trading days to play out (about three months).
As discussed above, these occur more frequently during secular bear markets. In the postwar period, one quarter of these occurred during the 1970s and another fifth of them occurred during the 2000s -- both periods were part of a secular bear market.
Note that in the secular bull market that began 1982, there was but one 10 percent correction in the first five years (1982 through the 1987 crash). After the 1987 crash through the March 2000 peak, there were just two corrections of that magnitude, according to Yardeni. As we noted last week, the economy seems to be OK, so this looks more like a correction than anything more serious, but that's just a guess on my part. We should know before the December Federal Open Market Committee meeting.
* For the purposes of our discussion, I am using 10 percent for a "correction," 20 percent for "bear market," and 30 percent for "crash," and 50 percent for "generational crash." These terms are random fabrications with no real meaning other than reflecting our base-10 numeric system.
Stocks in early stages of bear market: Ned Davis
http://www.cnbc.com/2015/08/25/stocks-in-early-stages-of-bear-market-ned-davis.html
In the midst of the Dow's largest three-day point decline in history, one market research firm moved assets to bonds from stocks.
"Given the extent of indicator deterioration, last week's action has moved us closer to the latter conclusion (that the stock market is in the early stages of a bear market)," Ned Davis Research said in a note early Monday.
"The equity downgrade is primarily a response to the mounting risk indicated by our Global Balanced Account Model," the note said...
Make your wish list for the next crash: Najarian
http://www.cnbc.com/2015/08/25/make-your-wish-list-for-the-next-crash-najarian-commentary.html
As the Dow, S&P 500 and Nasdaq slammed down on the open Monday, we got a firsthand look at what indiscriminate selling looks like.
The initial trigger was a likely a combination of spillover from Asian and European markets. As these closed at their lows, traders who provided exits (were buyers) had to hedge that long exposure as best they could and that meant selling in U.S. pre-market as well as on the open. This pressure took futures down triple digits which, I imagine, panicked some investors and they entered orders to sell their long positions and cut the pain.
Some were likely prudent enough to offer these trades at a limit price, but a host of others and a clear majority must have entered market orders, meaning they would sell at ANY price. It's this indiscriminate selling, from these individuals and from brokers selling to satisfy margin calls that put the turbo on the market selloff.
In virtually every case we examined using our Heat Seeker technology, the opening price of securities was 3 percent to 7 percent above the lowest traded price, which came within mere moments of the 9:30 am open. Apple for instance opened at $94.87 but immediately traded to $92 (down 3 percent). Facebook opened at $77.03, but traded to $72 (down 6 percent) in minutes. It was this second leg down that took market losses to a paper loss of $1.2 trillion just after the open.
Despite the haphazard selling, some, including our wealth-management firm elected to be buyers on the open. I imagine one reason the buyers jumped in was they were adhering to the Warren Buffett adage, "buy when others are fearful." While this certainly played into our thought process, the primary reason we punched the "buy" button was because stocks on our wish list, which included Disney, Facebook, Exxon-Mobile and Apple were indicated for sale at 2 times the broad market distress. In plain English, if the S&P 500 was selling down 4 percent why was Apple, which closed Friday at $105.76 being indicated at $98, a drop of 7 percent? Or Facebook, which closed at $86.06 being indicated at $77, a drop of 10 percent? To us, this was THE opportunity we had waited for and why we'd kept dry powder....
The Stock Market’s Dive Is Global and Rational By John Cassidy
http://www.newyorker.com/news/john-cassidy/the-stock-markets-dive-is-global-and-rational?mbid=nl_082515_Daily&CNDID=26139401&spMailingID=8014206&spUserID=MzkxMjA1MjAwODQS1&spJobID=743022122&spReportId=NzQzMDIyMTIyS0
In any stock-market dive, two questions immediately arise: How far will it go? And is it justified on the basis of economic fundamentals? Obviously, the two questions are connected, but they aren’t the same.
The only sensible answer to the first question is: “I don’t know.” As the late Paul Samuelson once observed, when a financial market starts falling sharply we move into the realm of the physics of landslides: things become complicated and unpredictable. In some cases, the market’s fall can feed on itself, as it did on Monday, October 19, 1987, when the Dow Jones Industrial Average fell 22.6 per cent. A computer-trading strategy known as “portfolio insurance”—which was originally designed to limit investors’ losses—generated huge sell orders in the futures market, which led to further losses on the New York Stock Exchange, which led to more selling in the futures market. And so on.
In other cases, the falling market reaches a resistance level, and buyers emerge to limit the losses. So far, this swoon, which began last week, looks to be of the benign type, with few signs of outright panic. On Friday, following sharp falls in overseas markets, the Dow fell more than five hundred points, or about 3.1 per cent. On Monday, it fell about a thousand points as soon as it opened, then regained about half of its losses and held on from there. It closed at 15,871.35, a fall of 3.6 per cent. In the course of the past week, it is down 9.5 per cent. That’s a big tumble, to be sure. But the market hasn’t seen a significant correction since 2011, and we were due for one.
Obviously, things could get worse. Whether they do or not depends on whether, in the next few days, the turmoil in the Chinese market continues and signs of financial distress emerge here at home—for example a big hedge fund or financial institution getting into trouble. Bull markets, such as the one Wall Street has enjoyed for the past six years, generate a great deal of risk-taking, which often involves using some hidden type of leverage to enhance returns. As Warren Buffett famously remarked, “Only when the tide goes out do you discover who’s been swimming naked.”
The answer to the second question I raised above, about economic fundamentals, is that the market’s fall is perfectly justified. In a sharp post on Sunday, my colleague James Surowiecki pointed out that stock prices have been rising steadily in relation to earnings. For a quite a while now, analysts who take seriously such valuation ratios as the price-to-earnings ratio and Tobin’s “q” ratio (which measures the price of investment assets relative to their replacement cost) have been warning about a crack in the market. Back in February, Andrew Smithers, a London-based analyst, warned that the U.S. market was trading seventy per cent above its fair value. In May, Bob Shiller, a well-known economist who teaches at Yale, said that there was a “bubble element” to the valuations present in the market.
As always, the issue is timing. Raging bull markets usually go on for longer than skeptics (such as myself) predict that they will, and they rarely end of their own accord. Sometimes, the precipitating event is the prospect or reality of the Federal Reserve deciding to raise interest rates. (That’s what happened in 1987 and 2000.) On other occasions, it takes some sort of shock, such as the collapse of Lehman Brothers, to set things off.
On this occasion, there was a surfeit of proximate causes. For one thing, the era of zero-per-cent interest rates and ultra-cheap money appears to be coming to an end. With G.D.P. growth picking up a bit after another slow start to the year, Wall Street expects the Fed to start raising rates either next month or in December. Then there is what’s happening in the developing world. It’s not just that the Chinese economy is slowing down and prompting the government in Beijing to take countervailing measures, such as trying (and so far failing) to prevent a stock-market bubble from bursting. Brazil is in terrible shape and may be headed for a financial crisis. The Russian economy, hit by sanctions and a collapsing oil price, is also in a slump. Of the original BRIC countries, only India looks to be in good shape.
Even in a country such as the United States, which has a relatively small trade sector compared to many other nations, a “hard landing” for the world economy would negatively impact G.D.P. growth. (Although the big fall in the oil price should offset this somewhat, by boosting consumers’ spending power.) And for U.S.-based multinational companies, which make up the bulk of the Dow and S&P 500, a sustained global slowdown could have a very large impact on revenues and profits. That alone probably justifies the trim applied to stock-market valuations in the past few days.
In short, the economic outlook has dimmed. Global stock markets, which had risen sharply during a prolonged period of easy money, needed to fall to reflect this new reality. That’s what’s happening now, and, given the way markets work, there is always the possibility that they will overshoot on the downside....
Edit history
Please sign in to view edit histories.
34 replies
 = new reply since forum marked as read
Highlight:
NoneDon't highlight anything
5 newestHighlight 5 most recent replies
RecommendedHighlight replies with 5 or more recommendations
= new reply since forum marked as read
Highlight:
NoneDon't highlight anything
5 newestHighlight 5 most recent replies
RecommendedHighlight replies with 5 or more recommendations
= new reply since forum marked as read
Highlight:
NoneDon't highlight anything
5 newestHighlight 5 most recent replies
RecommendedHighlight replies with 5 or more recommendations
Dow, S&P Close Lower In Biggest Reversal Since Oct. 08 REPOST FROM LBN BY brooklynite
Demeter
Aug 2015
#5
Why Goldman thinks the S&P 500 is headed for an 11% rebound By Barbara Kollmeyer
Demeter
Aug 2015
#14
PUBLIC SERVICE REMINDER: Stock Trading in U.S. Will Pause If S&P 500 Plunges 7%
Demeter
Aug 2015
#16
Saudi Arabia Is Seeking Advice on Cutting Billions From Its Budget in the Wake of the Oil Crash
Demeter
Aug 2015
#17
Here's What Usually Happens to Markets After the S&P 500 Drops 5 Percent in a Week
Demeter
Aug 2015
#18