The question is how long will it take before CARBON is phased out; to that end we look at solar, wind, biomass, biomethane, geothermal and all types of hydro.
Given the performance in growing their coal industry and the now low and going lower cost of renewables, there is no reason to think that the rate of growth curve for renewables will not be at least as aggressive as that of coal.
In order to get a feel for that, let's look at China's build-out rate of carbon and non-carbon energy sectors. This graph shows the performance of both sectors over the last 12 years, since their big expansion began. The carbon line includes oil, gas and coal. The non-carbon line aggregates all renewables, hydro and nuclear power. Then the current trends are extrapolated out 6 years, based on these two assumptions of yours:
1. The growth curve of of renewables will be at least as aggressive as that for carbon energy. The curve chosen for renewables is a very aggressive 4th order polynomial, while the carbon trend shown is linear.
2. Change requires time. This implies that the policy decisions in place over the last 5 or ten years that are driving today's situation will remain in force for at least the next 6 years.
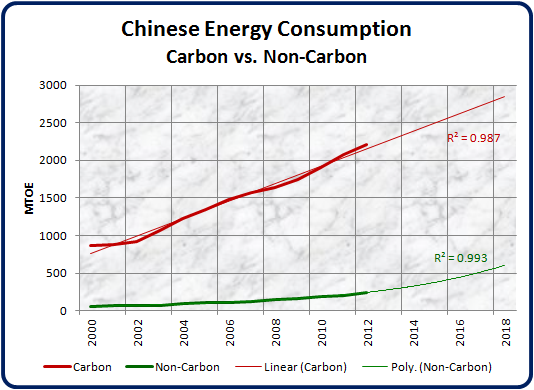
The 350 mtoe increase in renewables over the next 6 years represents the addition of between 2000 and 2500 GW of renewable capacity (with an average capacity factor of around 25% to factor in wind, hydro and solar).
Carbon-based energy, on the other hand, adds over 1000 mtoe in the same period - three times as much - under very pessimstic growth assumptions. (Note that as well as using a linear trend, I started in the year 2000, including the flat toe of the coal curve in the trend-line, thus flattening it further.)
So, based on your own assumptions, we may conclude that it will probably be longer than 6 years before current renewable build-out rates begin to take market share away from coal.
Of course, if China decides to sacrifice their own economic growth for the sake of the planet's climate by reducing their coal use, all bets are off. Let's pray that happens.
 = new reply since forum marked as read