NNadir
NNadir's JournalA nice video about what I regard as the best thermal nuclear reactor ever designed and put into commercial service.
I don't think the reactor is being used to its best potential, which to my mind would make its potential for breeding new fuel high, a ternary plutonium/uranium/thorium fuel, and I don't approve of nuclear waste dumps, depositories, but the video is nonetheless excellent on a "beginner" level.
The CANDU:
New Weekly CO2 Concentration Record Set at the Mauna Loa Observatory, 430.93 ppm
As I've indicated repeatedly in my DU writings, somewhat obsessively I keep spreadsheets of the of the daily, weekly, monthly and annual data at the Mauna Loa Carbon Dioxide Observatory, which I use to do calculations to record the dying of our atmosphere, a triumph of fear, dogma and ignorance that did not have to be, but nonetheless is, a fact.
Facts matter.
When writing these depressing repeating posts about new records being set, reminiscent, over the years, to the ticking of a clock at a deathwatch, I often repeat some of the language from a previous post on this awful series, as I am doing here with some modifications now. It saves time.
The most recent post (not my last on this topic, assuming I live through this year) reflecting updating this last year is here:
New Weekly CO2 Concentration Record Set at the Mauna Loa Observatory, 430.86 ppm
The readings are, as of this morning as follows:
The readings are, as of this morning as follows:
Week beginning on March 22, 2026: 430.93 ppm
Weekly value from 1 year ago: 428.41 ppm
Weekly value from 10 years ago: 405.98 ppm
Last updated: March 29, 2026
Weekly average CO2 at Mauna Loa
This is the new all time highest record, 430.93 superseding 430.86, ppm, set last year in May.
As I always remark in this series of posts, if one looks, one can see that the rate of accumulation recorded at the Mauna Loa CO2 Observatory is a sine wave superimposed on a roughly quadratic axis:

Monthly Average Mauna Loa CO2
We should expect the final "all time record" in late April or in May, whereupon the concentrations will decrease until late September or October.
Weekly average CO2 at Mauna Loa
In 2025, the then highest value ever recorded 430.83 ppm took place in the week beginning May 5, 2025, and fell thereafter. In 2024, the then highest value ever recorded 427.94 ppm took place in the week beginning April 21, 2024, and fell thereafter. In 2023, the then highest value ever recorded 424.64 ppm took place in the week beginning May 28, 2023, and fell thereafter. In 2022, the then highest value ever recorded 421.63 ppm took place in the week beginning May 29, 2022, and fell thereafter and so on.
The current reading is the 8th reading to exceed 430 ppm, seven of which happened last year, out of 2616 week to week comparators going back to the opening of the observatory in the second half of the 1970s.
As it happens - I consider it statistical noise - 2026 has started out as a rather mild year for new accumulations of the dangerous fossil fuel waste carbon dioxide in the planetary atmosphere, when viewed as week to week comparisons with the same week of 2025. Only one week in 2026 has seen an increase over 3.00 ppm over that of 2025, that of week 8, the week beginning February 22, 2026, when the increase over week 8 of 2025 was 3.04 ppm. Overall however, the 21st century is appalling on this metric. In the 20th century, going back to 1976, 3.82% of weekly readings recorded and compared to the previous year exceeded 3.00 ppm. In the 21st century, 16.89% of weekly readings recorded and compared to the previous year exceeded 3.00 ppm.
One may wish to argue that the mild readings at the outset of 2026 is all about solar and wind crap - all of which will be landfill in 20 to 25 years along batteries and hydrogen redundancy schemes designed to obscure that so called "renewable energy" is actually backed up by dangerous fossil fuels - that it is not, irrespective of my sense to the contrary - statistical noise. People love to jump up and down celebrating the useless solar and wind industries despite their odious failure to address the collapse of the planetary atmosphere. I hear lots and lots of prattling about solar and wind in China - ignoring the huge tragedy of rather dirty lanthanide mines in Baotou - while no success is attributed to the fact that China has built 61 new nuclear reactors in this century, and has 38 under construction, a rate of nuclear construction not seen since the construction of more than 100 reactors in the United States, and over 50 in France in the 20th century.
Actually, though, my belief that nuclear energy is the only sustainable form of climate gas free energy that is acceptable and sustainable notwithstanding, I don't really believe the noble nuclear efforts of China are having much effect. It's helpful, but hardly enough. In a sustainable world, we would need thousands of nuclear reactors, not hundreds.
Assuming that the Mauna Loa CO2 Observatory is not shut by the anti-science bigots who have seized control of our government and canceled our Constitution, we are likely to see higher readings this year. The consequences, irrespective of whether the numbers are available and honestly reported, will not be subject to lies or misrepresentations by potentially thuggish liars; the planet will continue to burn, the weather will become more extreme and out of control. Oh and assholes will still carry on about how nuclear energy is "too dangerous," and the destruction of the planetary atmosphere isn't "too dangerous." These people will tell us, in a delusional counterfactual statement that so called "renewable energy" will save us. These chanting people who chant that "renewable energy" will save us and that nuclear energy is "too dangerous," will continue to so chant despite the observable fact that "renewable energy" has not saved us, isn't saving us, and, I assert, won't save us. People say we "need" solar and wind. We don't. They remain trivial sources of primary energy.
The reactionary impulse to make our energy supplies dependent on the weather, this precisely at the time we have destabilized the weather by lying to ourselves about our continuous and rising use of dangerous fossil fuels, was always an ignorant attack on nuclear energy. It was never about preventing the extreme global heating we now observe, never about the environment (you don't tear the shit out of wilderness to make industrial parks and declare yourself "green" ) and never about costs, since the required redundancy - while kept off the books dishonestly - is expensive, and, as it is almost always fossil fuel based, dirty.
We still have people here at DU, this late into the disaster prattling on about how so called "renewable energy" is beating out nuclear energy, even though the combined solar and wind industry combined has never, in an atmosphere of sybaritic bourgeois saturnalian enthusiasm, not once, produced as much primary energy as nuclear energy produces routinely in an atmosphere of malign (and ignorant) criticism.
It is interesting and notable that the same people who still carry on with stupid reference to "costs" - they couldn't give a fuck about the cost of the extreme global heating we are now experiencing - and attack nuclear energy on this basis are completely and totally disinterested in attacking the unimaginable external costs of dangerous fossil fuels, costs recorded in millions of deaths and expensively treated diseases each year, the destruction of vast ecosystems by fire and alternately inundation or just plain heat.
Irrespective of their inane anti-science rhetoric about batteries and hydrogen, as it disregards the laws of thermodynamics, an apologetic orgy of wishful thinking designed to make the failed solar and wind industries appear to be reliable, which they will never be, all the money spent on solar and wind is clearly wasted and ineffective. The impulse is reactionary, to make our energy supplies depend on the weather, precisely at the time we have destabilized the weather because the reactionary fantasy is not working.
How much money is it?
The amount of money spent on so called "renewable energy" since 2015 is 4.9 trillion dollars, compared to 524 billion dollars spent on nuclear energy (including a vague term the IEA calls "other clean energy" ), much of the latter to prevent the willful and deadly destruction of existing nuclear infrastructure. Presumably "other clean energy" includes fusion, which has provided zero useable energy for any purpose
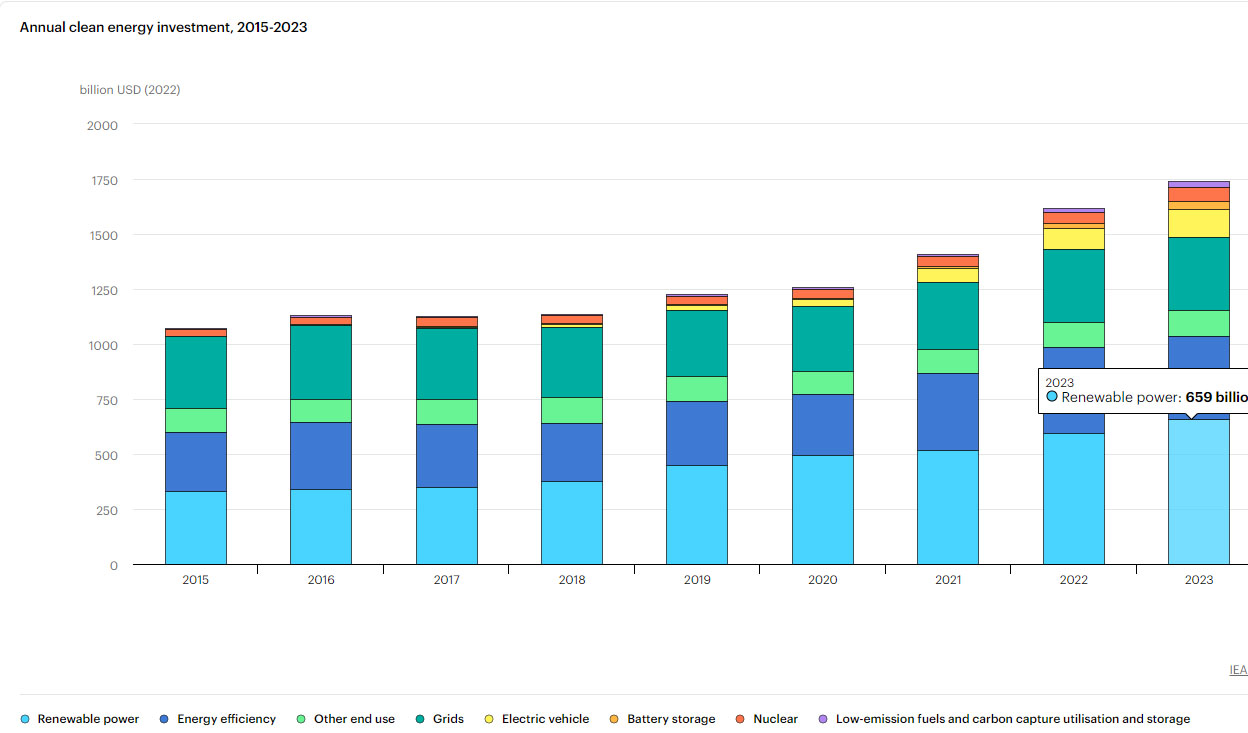
IEA overview, Energy Investments.
The graphic is interactive at the link; one can calculate overall expenditures on what the IEA dubiously calls "clean energy," ignoring the fact that the expenditure on so called "renewable energy" is basically a front for maintaining the growing use of fossil fuels. One may also download a *.csv file with the data.
My strong opinion that nuclear energy is the last best hope of the planet is not subject to change by appeals to clap trap about so called "nuclear waste," the big bogeymen at Fukushima, Chernobyl (and even more silly) Three Mile Island, blah, blah, blah...
I suggest finding someone more credulous than I to whom to chant endlessly about these points. Take a drive in your swell car out to a "no nukes" concert and convincing yourself that rock stars know more about energy than engineers and scientists. You deserve it. Whether future generations suffer in extreme poverty because of your smug pleasures and appalling selective attention is not your concern.
Oh, and of course, be sure self identify as an "environmentalist." As one who gives a shit about extreme global heating, I won't credit this self identification anymore than I credit Donold Trump's descriptions of himself as a "very stable genius" and all that, but who cares what I think? The "...but her emails..." and "...sane washed Donold Trump..." media describes antinukes as "environmentalists" after all, even if I find that absurd and delusional, so there's that.
Be sure to prattle on about your complete and total indifference to the laws of thermodynamics, laws of physics that are not subject to repeal by appeals to wishful thinking, by carrying on about energy storage, lots of battery bullshit, hydrogen bullshit, etc. as if there was enough so called “renewable energy” to store for months at a time. There hasn’t been any such "renewable energy" surfeits, to justify this junk, there aren't any and there won’t be any, but none of this should prevent you from the ruined landscapes and mining pits you leave for future generations. Screw future generations. If they need resources, they can sort through our landfills and ruins.
Tell everyone you know that it’s OK to spend ten times more money on solar and wind as we spend on nuclear energy, even though the trillion dollar quantities squandered on them haven’t done a damned thing to address extreme global heating, aren’t doing a damned thing to address extreme global heating, and won’t do anything to address extreme global heating, but will leave a legacy of dead industrial parks where wilderness used to be.
Do all these things. Don't worry. Be happy.
Our media will declare you an “environmentalist.” Good for you.
As for me, I'm far more concerned with the collapse of the planetary atmosphere than I am with the fear that someone somewhere at sometime may die from an industrial accident involving radiation. Let me repeat: I am far more concerned with the vast death toll, extreme environmental destruction, and the global heating associated with the normal use of dangerous fossil fuels than I am about carrying on insipidly about Fukushima.
Nuclear energy is not risk free, nor will it ever be. It is simply vastly superior to all other options, which in a rational world, as opposed to the one in which we live, would be enough to embrace it.
When our country, as precious as it has been to us, is an ancient memory, the rot we left behind in the planetary atmosphere will still persist.
History, should history remain recorded and accessible, will not forgive us, nor should it.
Have a pleasant Sunday afternoon.
Rheumatic Fever Is An Autoimmune Syndrome Leading to Heart Disease: Strep Throat and Antibiotic Access.
Over the years, I've used my access to the scientific literature to help friends and family to understand major health issues. As I have lived a long life with few major health problems, I've never had to do it for myself: Until now.
My mother was one of ten children who lived to adulthood - an additional three died as children from unknown causes. Several of my aunts who reached adulthood, and my mother, all had various degrees of heart disease, in each case it valvular, and as I was growing up, the etiology was described to me - in decidedly non-scientific terms as resulting from "rheumatic fever." Three of my aunts died from this form of heart disease.
I'm an old man now, and kind of smug in offhand ways about assuming things about health family history, only finding out years after the fact, at least apocryphally, the truth about probable cause of fatal diseases. For example, I mused nervously that my mother's death by a brain tumor elevated my own risk, only to find out, decades later, that the cause was occupational; the plant where she worked is now a superfund site, and the sister of a coworker (my cousin) told me lots of people in the plant were getting brain tumors. Thus, similarly, I relied, lazily, on my glib assumption that "rheumatic fever" was the result of a specific type of specific pathogenic, but rare organism and that everyone faced a risk of the disease that was now treated by antibiotics.
The paper to which I'll refer, is a review article referring to a genetic disposition toward valvular heart disease such as the aortic stenosis, which I apparently may have and for which I am being evaluated with a rising series of tests. It is this one: Muhamed, B., Parks, T. & Sliwa, K. Genetics of rheumatic fever and rheumatic heart disease. Nat Rev Cardiol 17, 145–154 (2020). It is a rather detailed paper, and I will not have time to discuss it in any depth, but it is interesting, and probably relevant to my own case, as I had several episodes of strep throat in my youth, and in one case, it took several days for me to find someone to drive me to a doctor to get a prescription for antibiotics. While I have access to the full paper it is, regrettably behind a firewall for the general public. At the time I was poor.
When I was a young man, one of the main foci of our party, the Democratic Party, was addressing poverty, not only here in the United States, but all over the world. This focus has receded to an uncomfortable sense, but, as we are sinking into third world status under the weight of racism, ignorance, contempt for science, erosion of medical care, etc. it is perhaps relevant to consider it, as the pathogenic organisms and viruses come home to roost.
From the introduction of the paper:
RHD remains a public health priority in low-income and middle-income countries, despite being nearly eliminated from high-income countries5,6,7,8,9,10. In 2005, approximately 471,000 cases of RF were estimated to occur annually, of which 336,000 were in children aged 5–14 years11. Current global estimates suggest that, in 2015, 33,194,900 patients were living with RHD in RHD-endemic countries, whereas there were only 221,600 affected individuals in non-endemic countries12. The total disability-adjusted life-years lost to RHD globally in the same year was estimated to be 10.5 million12. The highest age-standardized mortality from RHD occurs in Oceania, south Asia and central sub-Saharan Africa12..
The role of genetic susceptibility in developing RF and RHD has been highlighted in familial studies and in the observation of different clinical outcomes after GAS infections16,17. The unexplained predisposition to RHD among certain individuals in the population suggests a genetic contribution to the condition18. In this Review, we assess the emerging role of genome-wide association studies (GWAS) in RHD research, outlining both the advantages and disadvantages of this approach. We also highlight the potential use of large-scale, publicly available data sets and the opportunity for large-scale collaborative studies, which are substantially more likely to produce findings that have ramifications for clinical practice.
A combination of risk factors can influence susceptibility to GAS, RF and ultimately RHD (Fig. 1). The risk of developing RHD is likely to be defined by an interaction between GAS infections, such as streptococcal pharyngitis, the socioeconomic status of the patient and community, access to primary health care and genetic susceptibility1,17,19.
I bolded the parts about poverty.
A figure from the text:
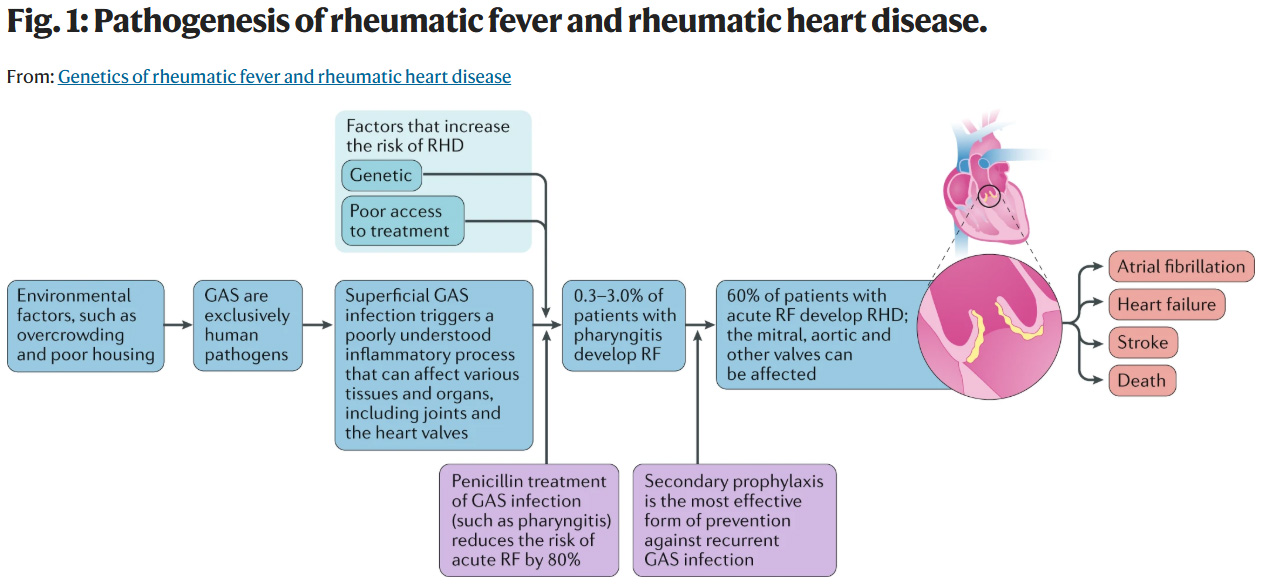
The caption:
Even though I'm an old man, who has lived a long and finally happy life, the two bottom outcomes on the right side, in orange, the color of the dementia stricken pedophile in the White House, are scary. (I'm looking into the stroke risk associated with one treatment for this disease. It's not entirely reassuring.) I recognize that I'm not immortal, but facing mortality with a specific cause in mind is unsettling.
More text:
Family-based studies offer an important starting point in genetic epidemiology through which the genetic determinants of a trait of interest can be assessed24. Familial aggregation can be defined as the occurrence of a disorder at a higher frequency in relatives of affected persons than in the general population, attributable to genetic and/or environmental factors25. If established, familial aggregation might indicate genetic inheritance, aggregation of risk factors or a gene–environment interaction related to the disease26,27.
Early studies describing RF and RHD recognized the frequent occurrence of multiple cases in the same household or family28,29. As early as 1889, Cheadle noted that the risk of RF in an individual with a family history of the disease was nearly fivefold greater than that of an individual with no family history16.
Check on that one, my dead aunts.
A little further on:
Since the 1980s, several investigators have linked specific human leukocyte antigen (HLA) markers to susceptibility to RF and RHD. Initially, this association was on the basis of serological typing using the two-stage microcytotoxicity method32. Later, with the inception of molecular methods, this approach was superseded by methods based on sequence-specific primers32. From the 1990s onwards, molecular methods became the preferred HLA typing method.
HLA genes are found within the major histocompatibility complex on chromosome 6, a complex region of the genome containing ~260 genes and spanning ~4 Mb (ref.33). The role of the HLA molecules themselves is to bind peptides and present them to receptors on T cells, but the locus also contains numerous other immune-related genes with a variety of functions.
The authors discuss GWAS analysis (Genome-wide association studies) to identify the genes:
There have been multiple studies, the limitations of which are small sample sizes, but the suspect genes, according to the paper are thought to be on chromosome 6, coding for the HLA (Human Leukocyte Antigens), however, a highly correlated gene has been found in Melanesian populations on chromosome 4:
Researchers are combing through the data of the commercial company 23andMe to get more insight. (The company does not exist to really tell you about your family history and whether you are descended from the awful British Royal Family with genes from Wales or northern Germany. It exists to sell medical data related to susceptibility genetic diseases, so pharmaceutical company's can decide on which diseases to invest in.)
Cool, or disturbing. I'm not Melanesian, of course, but I now believe I have some problem genes in any case.
I have been advised medically to limit my activities until after the completion of a series of tests. I regret I will not be able to participate in NO KINGS protests today, but my heart, defective as it may be, is with those who go.
Oh, if you know a young person suffering from strep throat, or for that matter, an old person, and there is a family history of this sort of thing, get them to a doctor fast.
Have a good time at NO KINGS, if you can and do go, and a wonderful weekend beyond that.
What's classy if you're rich but trashy if you're poor?: 28 of the most illuminating answers
I was going to post this in the Lounge, but the #1 "classy if you're rich" definitely has political implications.
What's classy if you're rich but trashy if you're poor?: 28 of the most illuminating answers
It's spot on, I think, the whole series.
What advice would you give to a young person considering a career in nuclear?
The answer:
We don't have too many young people here at DU, and old people have screwed the future generations by consuming all the world's best ores, often for silly affectations, like say, so called "renewable energy," a reactionary enterprise, while destroying the planetary atmosphere, probably irreversibly, this partially - to a large extent actually - as a function of antinuke cult success in entrenching fossil fuel use.
However, I raised a person entering a career in nuclear, after realizing in his childhood that indeed, he loved physics, science and engineering. At the end of my life, this is one of the great joys, raising, with my wife, a young man choosing a career in service to humanity.
The quote comes from an except of an interview with a nuclear CEO here:
Podcast: What should be the target time to build a nuclear plant?
Let me engage in the popular sport of soothsaying around here: It is predicted that by 2030 China will surpass the United States as the largest generator of nuclear power. The fact that the United States is still the world's largest supplier of nuclear energy despite demonization by dummies, and having built very few reactors for decades should tell people something, which is this:
A nuclear plant is a gift to a future generation. Building a nuclear plant is thus a reflection of a kind of selfless decency.
China is producing nuclear reactors at a fast pace, from groundbreaking to grid connection in about five to six years. I expect they will continue to approve the speed at which they can do this.
A recent announcement:
Early construction landmarks for Chinese units
The construction of Phase I (units 1 and 2) of the Bailong plant in China's Guangxi Zhuang Autonomous Region was among approvals for 11 new reactors granted by China's State Council in August 2024. State Power Investment Corporation (SPIC) plans to build two CAP1000 pressurised water reactors - the Chinese version of the Westinghouse AP1000 - as the first phase of the plant. An investment of about CNY40 billion (USD5.6 billion) is planned for the two units, which are expected to take 56 months to construct.
Excavation work for the foundation pit began in late December 2024. SPIC subsidiary Shanghai Nuclear Engineering Research & Design Institute (SNERDI) - joint general contractor for the project - announced it poured the first concrete on 22 December 2025 for the basemat of the nuclear island at Bailong unit 1. The company said a total of a 6,662 cubic metres of concrete was poured in a process lasting just over 64 hours.
Located on Jiangshan Peninsula in Fangchenggang City, Guangxi Province, the Bailong plant is planned to have six units, with a total installed capacity of 8.62 GWe and a total investment of approximately CNY120 billion. The first phase of the project adopts the CAP1000 design, with each unit having a capacity of 1.25 million kilowatts. Four CAP1400 reactors are also proposed to be built at the site - located about 24 kilometres from the border with Vietnam and about 30 kilometres southwest of China General Nuclear's Fangchenggang nuclear power plant - in later phases...
The article just cited continues to state that the reactors described will avoid the consumption of 6 million tons of coal that would, if combusted, dump about 16 million tons of carbon dioxide into the planetary atmosphere each year. Nuclear plants are designed to run for 70 to 80 years these days. This means over their lifetimes, the six units described here will avoid over a billion tons of carbon dioxide dumping.
Historically, nuclear reactors could be built very quickly. The United States, before its fall, built more than 100 reactors in a period of less than 25 years, and more than 90 still serve humanity in their function. What is required - what China now has - is the construction, manufacturing, and engineering infrastructure to do so
China has 61 nuclear reactors up and running, and as of today, 38 under construction.
I believe that with a functioning infrastructure and sensible regulation, as opposed to obstructive regulation, construction for nuclear reactors could be completed in three to four years. It seems a reasonable goal.
Well, duh. German energy minister calls nuclear phase-out 'huge mistake.'
It's too late, too little, pretty much the case with all issues in which nuclear energy was bashed on very tenuous - no, let's call stupid "stupid" - stupid grounds.
German energy minister calls nuclear phase-out 'huge mistake'
Speaking at the CERAweek international energy event in Houston, Texas, she said that prices of petrol, diesel and jet fuels in Germany were spiking "but we don't see any scarcities in terms of volume - but if the conflict doesn't end we [will] see this probably later in April or May".
She added that the longer the crisis continues the more stress will be put on the "fragile recovery of Germany's economy". Of the country's reliance on gas, she said previous governments decided to phase out coal because of the climate targets, and "the phaseout of nuclear was a huge mistake, a huge mistake and we miss this energy", which she said had provided 20 GW of CO2-free power production at affordable prices...
While I agree with her premise as to whether it was a huge - I would say "catastrophic" - mistake, what she offers as the reason for the "mistake" is pure nonsense.
The nuclear phase out had nothing to do with protecting the climate, since nuclear energy has the lowest CO2 impact of any major sustainable and reliable form of energy. On the contrary the phase out was absolutely the opposite of offering any concern for the climate.
Germany's Chancellor Friedrich Merz has also described the decision to move away from nuclear power as a mistake for the country, and European Commission President Ursula von der Leyen last month said it was "a strategic mistake for Europe to turn its back on a reliable, affordable source of low-emissions power"...
As I understand it, Ursula von der Leyen, a German politician was among those who voted for the nuclear phase out when she served in the German Bundestag.
German electricity typically has a carbon intensity for electricity production that is an order of magnitude (1000% in the "percent talk" that advocates of so called "renewable energy" use to defend their failed unsustainable systems) higher than that of neighboring France.
Electricity Map, 12 month data
Climate instability is not confined to the borders of those who have driven it. All of humanity is affected by this poor German decision.
Demand-Side Opportunities for Process Industry Participation in Electricity Markets
The paper I'll discuss in this post is this one: Demand-Side Opportunities for Process Industry Participation in Electricity Markets Iiro Harjunkoski and Santeri Vaara Industrial & Engineering Chemistry Research 2025 64 (51), 24675-24688.
The conception of this paper is one that's been on my mind, privately, for many years, which in my mind, I have labeled "The Kaiser Solution," based on something I heard some years ago, although I can no longer recall where I heard it, that Henry Kaiser would only run his Hall-Heroult aluminum plants when there was excess, and thus cheap, electricity on the grid in the Pacific Northwest, at that time, generally as a result of hydroelectricity production. On the other hand, when demand was high, the plants would be idled. I have no details of how this worked, and the business contracts behind the idea, or whether it was a wartime procedure, but again, the idea has stuck in my mind for many decades.
This is in opposition to the idea that energy storage is a good idea, an idea I often attack as thermodynamic and economic nonsense; it's environmental nonsense as well, since the need for redundancy - the default is actually dependent on dangerous fossil fuels despite all the hydrogen and battery bullshit that flies around - has economic and environmental consequences that are hardly benign. The belief that energy storage is a good idea is tied to the belief that the badly named "renewable energy" is sustainable, which it isn't, owing to its intense material and land demands, even before the pernicious need for redundancy is factored in.
I have never been shy around here from stating my opinion that nuclear energy is the only form of energy that I believe is acceptable. It is not risk free, but doesn't need to be vastly superior to all other options. A criticism of nuclear energy - which is only partially true - is that nuclear energy is not good at load following. Generally loads on the electric grid, almost everywhere in the world, peaks in the late afternoon and early evening hours. They are not flat.
Here for an example is a demand curve in my files on the CAISO (California) grid:
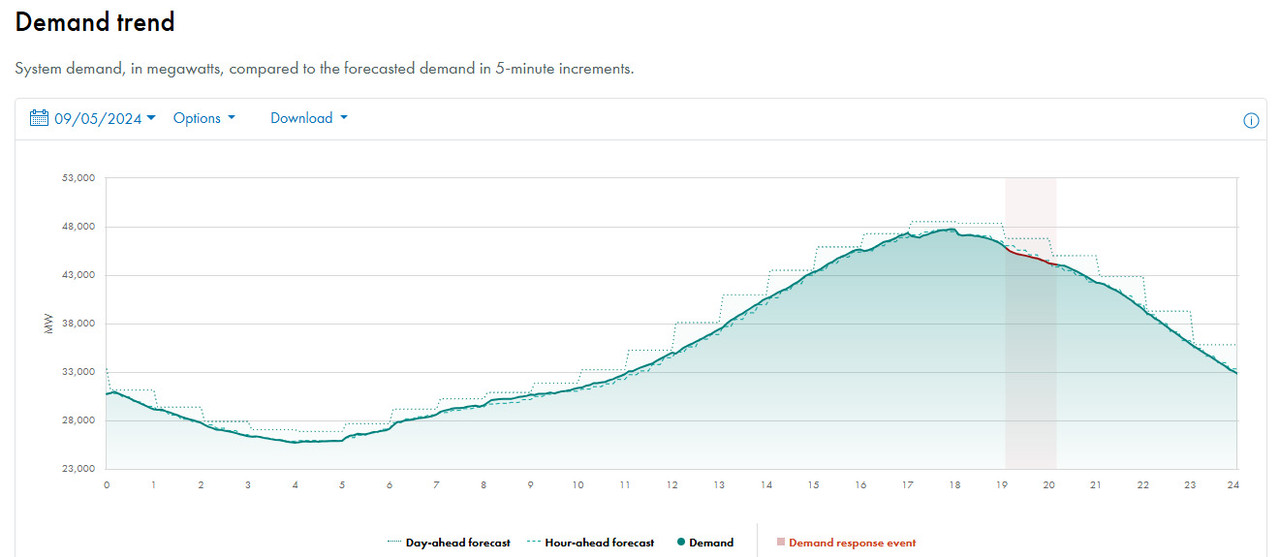
If one pokes around on the internet on almost any grid anywhere on any day of year, it is likely to look like this. Note that demand peaks when the sun is low in the sky or absent
Load following by nuclear plants involves - if one is feathering them down - on a simplistic level, inserting control rods to absorb neutrons. Because of reactor physics, particularly if a reactor is shut down completely, there is a lag time involved in powering up because of the decay of a radioactive isotope of iodine, 135I, into the radioactive isotope of xenon 135Xe, which has the highest neutron capture of all accessible nuclides, leading to "xenon poisoning" which - in the case of a total shutdown, can lead to a lag time for restart of several hours, until the 135Xe, (t1/2 = 9.1 hours) decays to 135Cs which has a moderate neutron capture cross section.
For these reasons it is generally believed that nuclear reactors run at or near full power, something they can, as the most reliable powerplants industrially available, do for years.
I have argued, here and elsewhere, that nuclear power plants should do far more than merely produce thermodynamically degraded electricity, via process intensification, that the high temperatures available from nuclear fuels should be utilized to increase exergy recovery. (Nuclear plants were originally conceived to replace coal plants in the first nuclear era, most coal plants at the time being low efficiency Rankine devices.)
For example, I offered a "pie-in-the-sky" idea of using nuclear heat for supercritical water desalination:
The Energy Required to Supply California's Water with Zero Discharge Supercritical Desalination.
With proper materials science systems, there is no reason that supercritical water resulting from the removal of ocean salts cannot produce, as a side product, electricity by turning a turbine, or alternatively, reform municipal waste (or sewage or industrial chemical waste) to yield carbon dioxide and hydrogen for fuel synthesis. If it happens that for industrial reasons - where for instance fresh water is the required product and electricity is not needed on the grid, that the power can be diverted to a plant utilizing electricity to reduce metal ores to the metal, as in the Hall-Heroult aluminum process or related processes such as the FFC process, or for that matter, a host of other applications in which electricity is used for production of commondities.
From the paper:
1. Controllable loads, where the grid operator can reduce/increase the load within specified limits. Examples of this are, e.g., large commercial building HVAC systems and some aluminum smelters in the United States (Alcoa), (3) as well as growing number of data centers.
2. Day-ahead bidding, where the industrial production process defines its production schedule based on an electricity price forecast and availability, trying to minimize its electricity cost while meeting the production targets. (5)
Both approaches have their merits and limitations. Controllable loads are fully managed by the network operator, and while, e.g., the ALCOA Warrick site reports enabling around 70 MW for this purpose, (3) the remuneration mechanism is still largely based on standard generator schemes. Thus, possible disruptions in production processes (the main business of the company) are not fully considered, and the magnitude of the regulation support is not reflected, i.e., the price per MW is the same for 10 MW as for 50 MW. However, operationally, these two situations can be significantly different. On the other hand, day-ahead bidding is purely based on price signals (or forecasts), and this is a relatively stiff approach that leaves little short-term flexibility for the production process. Unplanned disturbances in processes might disrupt the planned load schedule, resulting in heavy penalties that undermine the whole purpose of participating in demand response programs. Also, in many industrial environments, other base tariffs dominate, making DSM rather marginal, as the potential benefits are lower than the potential instabilities caused by price tracking. For instance, interrupting or delaying a smelting process step might result in temperature losses and the need for reprocessing, increasing the total energy need.
The topic of DSM first gained interest during the 1970s oil crisis, when rocketing energy prices created an urgent incentive for energy conservation and management. (6) Before the crisis, energy availability had been taken for granted, but suddenly, it became necessary to give high priority to the development of methods to better manage energy use. Although interest in DSM was reduced after the crisis, time-of-use and real-time pricing schemes were introduced to incentivize timing consumption for times of less congestion. The traditional consumption model was restored, and power and energy availability were again assumed to follow demand, and industrial processes were scheduled based on other constraining factors.
Process scheduling developed later with the increase in computational power from something done manually to finding mathematical optima, using computational models such as continuous-time approaches, (7) state-task network (8) (STN), and resource-task network (9) (RTN) models. The models are widely used for minimizing factors influencing process costs, such as makespan (10) and cycle time, (11) while considering the availability of other process variables, such as equipment, material, utilities, and personnel, and other resources when needed. Early DSM-adoption of the RTN model was done by Castro et al. (11−13) who expanded it to fit the needs of cement, steel, and the pulp and paper industry scheduling problems. DSM was again introduced as part of process scheduling when cost reductions for power-intensive processes realized their potential. Ierapetritou et al. (14) developed an MILP-based two-stage stochastic programming approach for minimizing the costs of an air separation plant based on electricity prices.
The potential for reducing electricity costs was recognized for many industrial processes, most notably air separation, (15−17) steel making industry, (13,18−20) electrolytic processes, (21,22) cement production, (23) and other heavy process industries...
...and so on...
The paper is rather long, and regrettably I will not have time to explore it here and now, but it makes a compelling case. Two figures offer cases for steel making, with the abbreviations described in the text:
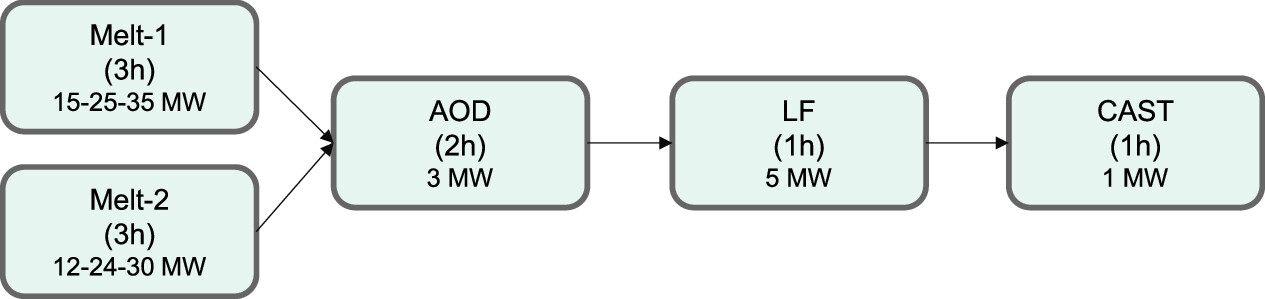
The caption:
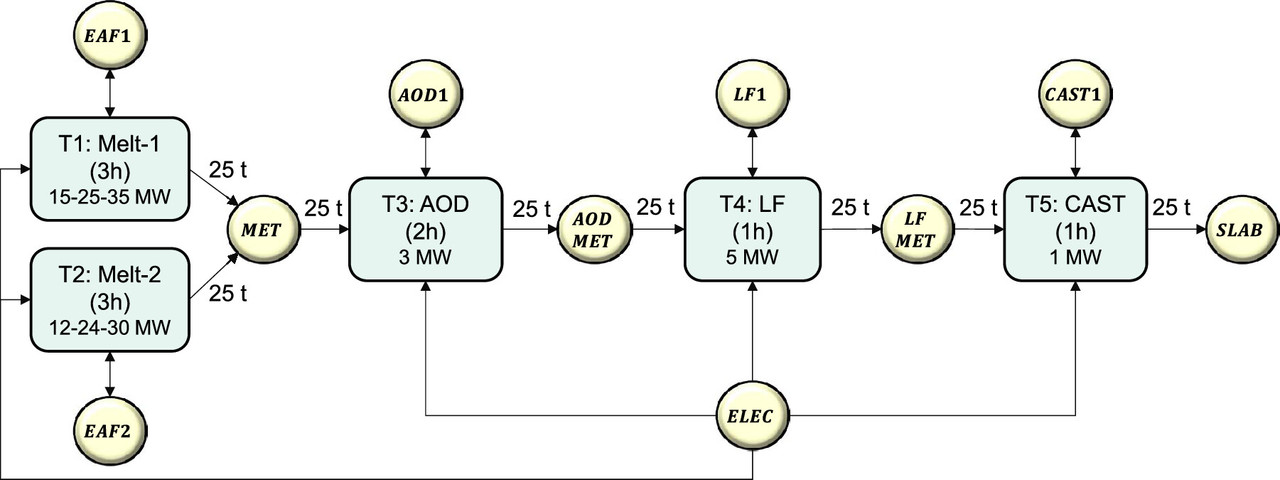
The caption:
The power grid always maintains - at least where the grid has driven by thermal powerplants - "spinning reserve" to address sudden changes in demand. It strikes me as a good idea to use this "extra" power for a useful purpose until demand calls on it. That is, on an admittedly simplistic level, the idea.
Have a nice day tomorrow.
A Very Moving Short Iranian Film Concerning the Street Children and Peddlers There, Prewar.
On Sunday, my wife and I went to an Lighthouse Film Festival, an anthology of short films, a retrospective being shown at the Princeton Garden Theater, The Best of the Fest.
Back in the early 90's, when we lived in San Diego on the few occasions where my wife and I went to Mexico, down to Ensenada, we were besieged on the street by children selling chicklets. You felt so bad and you found yourself handing out money and realizing you would never have enough. You could go completely broke in an hour trying hard just to be a human being and you will fail at it.
I experienced something very similar in Mumbai, where I was on a business trip, in the early 2000's, and again in Cuernavaca, again on a business trip.
This brings me to one of the films in the anthology that I can't get out of my mind, an Iranian short about children in the same space in Iran:
UNPARALLEL WORLD
...a film by Mohamad Yaraghi...
It's a scripted film, but it clearly portrays a reality in Iran.
How is it that we live in a world where poverty is allowed, never mind war on the impoverished?
In the film the death of a toddler being runover on the street when the light changes is portrayed, her death being no more important than running over a squirrel or a raccoon in the street here.
How?
How?
How is this allowed, and now, now, bombs?
I don't know where or how one can see this short film, but if one finds a way to do so, one should, and doing so, reach into the depths of our sad humanity.
Well, last night my wife made the sweetest unreasonable request of me.
We were talking on the bed, and out of nowhere, she said, "Honey, can you please live at least five more years. I don't want to live without you."
I'm facing a health problem, something treatable but potentially serious, with some risk, and she said that to me, out of nowhere.
I know her 44 years, in two of which I was living the treacly lyrics of the pop song "Cherish," this while running into her with the latest in series of her boyfriends:
You don't know how many times I've wished that I could hold you...
...but unlike the wimp in the song, I told her and got to hold her...
...and here we are, all these years later...
...and she's so damned sweet...
I can't believe I got to live this life with her; she made it so damned wonderful.
Whenever my time comes, the last thing I'll think is how much I love her.
I'll try to honor her request, but really, I don't want to live without her, and selfishly, I'd prefer to die first.
It's not really under my control, this outcome.
First New Nuclear Reactor Constructed at Idaho National Lab in 50 Years to Go Critical.
Aalo completes assembly of experimental reactorFriday, 20 March 2026 World Nuclear News.
Two weeks after being selected, the company broke ground on a plot of land at the border of Idaho National Laboratory (INL) to start construction of its first experimental extra modular nuclear reactor, the Aalo-X.
On Thursday, Aalo held a ceremony - attended by representatives from DOE, INL and supply chain partners, including Paragon Energy Solutions and Amsted Graphite - to unveil the completed reactor. Attendees toured the facility, viewing demonstrations of the control software and hardware, shielding systems, and the reactor itself...
Aalo-X has been manufactured at Aalo's pilot factory in Austin, Texas, before being transported to and installed at the INL site. The test reactor is the precursor to the Aalo Pod, a 50 MWe XMR (Extra Modular Reactor) power plant purpose-built for data centres. Each fully modular Aalo Pod will contain five factory built, sodium-cooled, Aalo-1 reactors, using low-enriched uranium dioxide fuel. The company says it will be in commercial use by 2029...
The scale of the reactor is shown by the photograph below from the article:
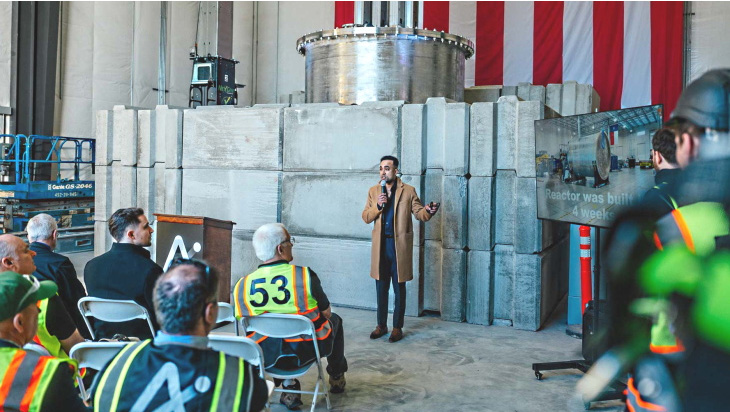
It's nice to see new reactors being built at national labs again, a pathway into the 4th nuclear era.
Profile Information
Gender: MaleCurrent location: New Jersey
Member since: 2002
Number of posts: 38,044