progree
progree's JournalGRAPHS (they provide so much additional perspective).
I annualize them all to be easy to compare to each other, and to compare to the FED's 2% goal. I use the actual index values rather than the one-digit changes that are commonly reported in the media. Links to the data are with the graphs.
ALL the numbers are the seasonally adjusted ones
The "1 month" number is the change from January to February expressed as an annualized number.
The "3 month" number is the growth over the last 3 months (and then annualized). It is calculated based on the change in the index number between the latest one and the one 3 months previous. e.g. if the latest index value is 304 and the one 3 months previous is 300, then the 3 month increase is 1.333333%
. . . (304/300 = 1.01333333 => [subtract 1 and multiply by 100%] => 1.333333%)
Annualized, it is 5.4%
. . . (1.01333333^4 = 1.0544095 => [subtract 1 and multiply by 100%] => 5.44095% => 5.4%).
. . . Most people just multiply the 3 month increase by 4 to annualize it: 1.333333%*4 = 5.333333% => 5.3% which isn''t technically correct (it leaves out compounding) but it is close for small percentage changes.
"Regular" is the "headline" number that has "everything"
"Core" is the regular with food, energy, and trade services removed (The Fed prefers this as a basis for projecting FUTURE inflation. Backtesting has found this to be true. ).
WHOLESALE INFLATION (PPI - the Producer Price Index)
https://www.bls.gov/news.release/ppi.nr0.htm
As for which core PPI measure, since the BLS highlights the one below (without food, energy, and trade services) in its reporting (as opposed to the one without food and energy), then I guess I should do likewise. Trade services bounce around a lot from month to month, so I think excluding them from a core measure is the right thing to do.
To summarize:
Latest 3 months average annualized: Regular PPI: 4.3%, Core PPI: 3.6%
Latest month annualized: (February over January): Regular PPI: -0.2%, Core PPI: 2.5%
CORE PPI (excluding food, energy, trade services) through February that came out 3/13/25:
CORE PPI (seasonally adjusted) http://data.bls.gov/timeseries/WPSFD49116

===========================================================
Regular PPI through February that came out 3/13/25 ( includes "everything" ):
Regular PPI (seasonally adjusted) http://data.bls.gov/timeseries/WPSFD4

If we claim February as being part of the Biden economy, then whose economy does December and January belong to?
===========================================================
If one doesn't believe my graphs, one can generate their own from these links:
CORE PPI (seasonally adjusted) http://data.bls.gov/timeseries/WPSFD49116
Regular PPI (seasonally adjusted) http://data.bls.gov/timeseries/WPSFD4
For whichever link you want to check, click on the link,
near the top right side is "More Formatting Options". Click on that
On the left side of the page that appears, click on these checkboxes:
Original Data Values, 1-Month Percent Change, 3-Month Percent Change, and 12-Month Percent Change.
Change the "Specify Year Range" to 2024 to 2025
Click Retrieve Data.
They don't annualize their numbers, but one can approximately annualize their 1-month numbers by multiplying by 12, and their 3-month numbers by multiplying by 4. (see top of this post on how I annualize using the actual index numbers).
Realize they start at January 2024 (when you specify the year range as 2024 to 2025) whereas my graphs start with February 2024.
I do this sanity check every time I post graphs like these (except for the PCE inflation which is produced by the Commerce Dept and one can't generate graphs like these straight from anything I know of).
Edited to add the 12 months averages graphs (same as Year Over Year) from the BLS links using the above method
Core PPI, 12 month rolling averages:

Regular PPI 12 month rolling averages:

Latest 12 month average : Core PPI: 3.3%, Regular PPI: 3.2%
GRAPHS - 3 month rolling average, and one month - both annualized. CPI and Core CPI
News report from the source: https://www.bls.gov/news.release/cpi.nr0.htm
CPI data series: https://data.bls.gov/timeseries/CUSR0000SA0
CORE CPI data series: http://data.bls.gov/timeseries/CUSR0000SA0L1E
I annualize everything to be comparable to each other and to compare to the Fed's 2% target
They are calculated using the actual index values, not from the rounded off monthly change numbers.
The CPI rise averaged 4.3% over the past 3 months on an annualized basis (core CPI: 3.6%)
The February one month increase annualized is: CPI: 2.6%, CORE CPI: 2.8%
REGULAR CPI

CORE CPI = CPI less food and energy

rolling 12 months averages graphs are in the OP
One reason for the decline in the 12 month average aka year-over-year is that the big Febrary 2024 increases dropped out of the 12 month window.
CPI increase in February 2024: 0.40% (4.86% annualized)
Core CPI increase in February 2024: 0.37% (4.54% annualized)
The number dropping out of the 12 month window is just as important as the one entering the 12 month window.
If the incoming number is lower than the outgoing number, then the 12 month average drops, plain and simple. (Similarly with any n-month rolling average).
Yes, it can happen. I reported a broken crosswalk button that has been that way since August
It was in the city of Crystal, Minnesota, an inner-ring suburb of Minneapolis. I found a contact form on the city's website on January 31 or so. I got an email from the Streets Superintendant on Feb 3 that they had not known about this before, and thank you, and hopefully it will be repaired sometime this week.
I found it working on February 14. (I don't know exactly what day it was repaired. My last 2 visits to that area were on Feb 5 (not repaired) and Feb 14 (repaired), so it just might have been repaired sometime that first week, or the week following).
I had thought it would be such a minor concern that nobody would respond, and nothing would be done, so why bother to look up how to contact them and write something. Also, the button housing was very visibly dangling by a wire from where it's supposed to be, for at least 6 months, so I had figured they would have known about it before. So it's nice to see that one can actually make a difference.
It's a busy 4-laner that I have to walk 3-4 heavy bags of groceries across (plus wearing a heavy backpack stuffed with groceries), and while it was broken, there was no walk-cycle. Others carrying grocery bags also use this crosswalk which is in front of the grocery store and goes across the street to the west-bound busstop -- another reason to think it probably was reported multiple times in the past, and so why bother.
ETA: I sent the Streets Superintendant a note of appreciation /EDIT
Anyway, just to encourage people to report "minor" issues.
GRAPHS - 3 month rolling average, and one month - both annualized. CPI and Core CPI
The Last 5 years were revised for seasonal adjustment factors (my graphs' data bases are updated)
News report from the source: https://www.bls.gov/news.release/cpi.nr0.htm
CPI data series: https://data.bls.gov/timeseries/CUSR0000SA0
CORE CPI data series: http://data.bls.gov/timeseries/CUSR0000SA0L1E
I annualize everything to be comparable to each other and to compare to the Fed's 2% target
They are calculated using the actual index values, not from the rounded off monthly change numbers.
What grabs me is that CPI rise averaged 4.5% over the past 3 months on an annualized basis (core CPI: 3.8%)
The January one month increase annualized is: CPI: 5.8%, CORE CPI: 5.5%
The last 3 months (Nov, Dec, Jan) are the "Trump trade" months. Although he wasn't president in November, December, or most of January (inauguration day was Jan 20), the righties claim that the stock market gains since the Nov 5 election are theirs, and call it The Trump Trade. For consistency, they need to own the CPI for those months as well, when businesses scrambled to adjust their inventories and supply chains to deal with -- as best they can -- the expected upcoming trade wars.
REGULAR CPI

CORE CPI = CPI less food and energy

rolling 12 months averages graphs are in the OP
Graphs and summary table of all 3 inflation measures (PCE, CPI, PPI)
The inflation situation as of the release of the PCE Inflation Index (Fed's preferred inflation gauge) on 9/27/24. Here is a summary table followed by the graphs.
CME Fedwatch tool (predicts Fed interest rate changes):https://www.cmegroup.com/markets/interest-rates/cme-fedwatch-tool.html
I annualize them all to be easy to compare to each other, and to compare to the FED's 2% goal. I use the actual index values rather than the one-digit changes that are commonly reported in the media. Links to the data are with the graphs.
ALL the numbers are the seasonally adjusted ones
The "1 month" number is the change from July to August expressed as an annualized number. Except the PCE is the increase from June to July, also annualized.
The "3 month" number is the growth over the last 3 months (and then annualized). It is calculated based on the change in the index number between the latest one and the one 3 months previous. e.g. if the latest index value is 304 and the one 3 months previous is 300, then the 3 month increase is 1.333333%
. . . (304/300 = 1.01333333 => [subtract 1 and multiply by 100%] => 1.333333%)
Annualized, it is 5.4%
. . . (1.01333333^4 = 1.0544095 => [subtract 1 and multiply by 100%] => 5.44095% => 5.4%).
. . . Most people just multiply the 3 month increase by 4 to annualize it: 1.333333%*4 = 5.333333% => 5.3% which isn''t technically correct (it leaves out compounding) but it is close for small percentage changes.
"Regular" is the "headline" number that has "everything"
"Core" is the regular with food and energy removed (The Fed prefers this as a basis for projecting FUTURE inflation)
Finally, the main summary table
All are seasonally adjusted and ANNUALIZED
PCE-Personal Consumption Expenditures Price Index (Fed's favorite inflation measure)
CPI-Consumer Price Index (retail)
PPI-Producer Price Index (Wholesale prices)
Links to the data are with the graphs below

Average real (i.e. inflation-adjusted) hourly earnings are up over the past 2 years and are above the pre-pandemic level:
. . . # Real average hourly earnings of production and non-supervisory workers: https://data.bls.gov/timeseries/CES0500000032
. . . # Real average hourly earnings of private sector workers: https://data.bls.gov/timeseries/CES0500000013
And now the graphs, in the following order:
* Core PCE and Regular PCE (Core PCE is the Fed's favorite for projecting FUTURE inflation), released 9/27/24
* Core CPI and Regular CPI
* Wholesale inflation - Core PPI and Regular PPI
CORE PCE through AUGUST that came out 9/27/24 (PCE=Personal Consumption Expenditures price index)
CORE PCE (seasonally adjusted): https://fred.stlouisfed.org/series/PCEPILFE
BEA.gov News release: https://www.bea.gov/ and click on "Personal Income and Outlays" or "Personal Income"
This is the one that the Fed weighs most heavily. The Fed weigh the PCE more heavily than the CPI. And in both cases, they weigh the CORE measures higher than the regular headline measures for projecting FUTURE inflation

Regular PCE through AUGUST that came out 9/27/24
Regular PCE (seasonally adjusted): https://fred.stlouisfed.org/series/PCEPI
BEA.gov News release: https://www.bea.gov/ and click on "Personal Income and Outlays" or "Personal Income"

CORE CPI through August that came out 9/11/24
CORE CPI (seasonally adjusted) http://data.bls.gov/timeseries/CUSR0000SA0L1E
BLS CPI news release: https://www.bls.gov/news.release/cpi.nr0.htm

The Regular aka Headline CPI through August that came out 9/11/24 (CPI=Consumer Price Index)
Regular CPI (seasonally adjusted) https://data.bls.gov/timeseries/CUSR0000SA0
BLS CPI news release: https://www.bls.gov/news.release/cpi.nr0.htm

Some Additional CPI Series of Interest
Shelter, which is pretty much all rent -- either regular rent or "owners' equivalent rent", has been a problematic issue -- because changes in new rents take several months before they appreciably move the CPI (because of the inertia of 11 months of older rents). It is the largest component of the Core CPI and one of the largest of the regular CPI. Through August, shelter remained elevated at 0.4% month over month for several months, except for a smaller 0.2% increase in June., and a larger 0.5% increase in August. Year-over-year, shelter is up 5.2%
Shelter: https://data.bls.gov/timeseries/CUSR0000SAH1
Core Inflation less Shelter: https://data.bls.gov/timeseries/CUSR0000SA0L12E
^--This is up 0.0% for 3 months in a row, followed by +0.1% in August. The 3 month annualized average is +0.0% (compare to core of +2.1%)
Click on "More Formatting Options" on the upper right hand of screen, and on the page that appears, choose some or all of: "1-Month Percent Change", "3-Month Percent Change" and "12-Month Percent Change".
Headline CPI and Fed Rate Action

November 2019 through August 2024
The first tentative little quarter point rate increase was March 17, 2022, 12 months after year-over-year inflation went north of 2% in March 2021, and had reached 8.5%.
I'm fond of the 3 month averages as they are an average of 3 data points (so can't be easily dismissed as a "one off", unlike a single month-over-month figure), and they have much more recency than 12 month averages (yoy). I think of them as kinda a smoothed version of month-to-month.
FedFunds Target Rate (I used the upper end of the 0.25% width bracket): https://www.federalreserve.gov/monetarypolicy/openmarket.htm
WHOLESALE INFLATION (PPI - the Producer Price Index)
https://www.bls.gov/news.release/ppi.nr0.htm
As for which core PPI measure, since the BLS highlights the one below (without food, energy, and trade services) in its reporting (as opposed to the one without food and energy), then I guess I should do likewise. Trade services bounce around a lot from month to month, so I think excluding them from a core measure is the right thing to do.
CORE PPI (excluding food, energy, trade services) through August that came out 9/12/24:
CORE PPI (seasonally adjusted) http://data.bls.gov/timeseries/WPSFD49116

===========================================================
Regular PPI through August that came out 9/12/24 ( includes "everything" ):
Regular PPI (seasonally adjusted) http://data.bls.gov/timeseries/WPSFD4

Markets - graphs: Dow, Oil, Dollar, Pound, Euro. Also: bonds and Listmania
Dow, Oil, and Dollar (last 12 months) - they update a few hours (like about 6 hours) after the close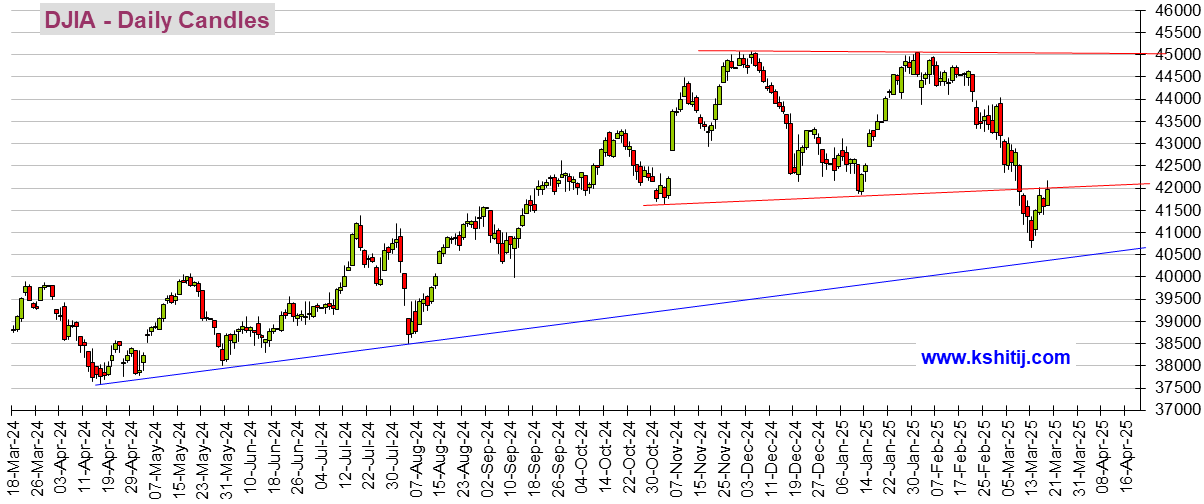
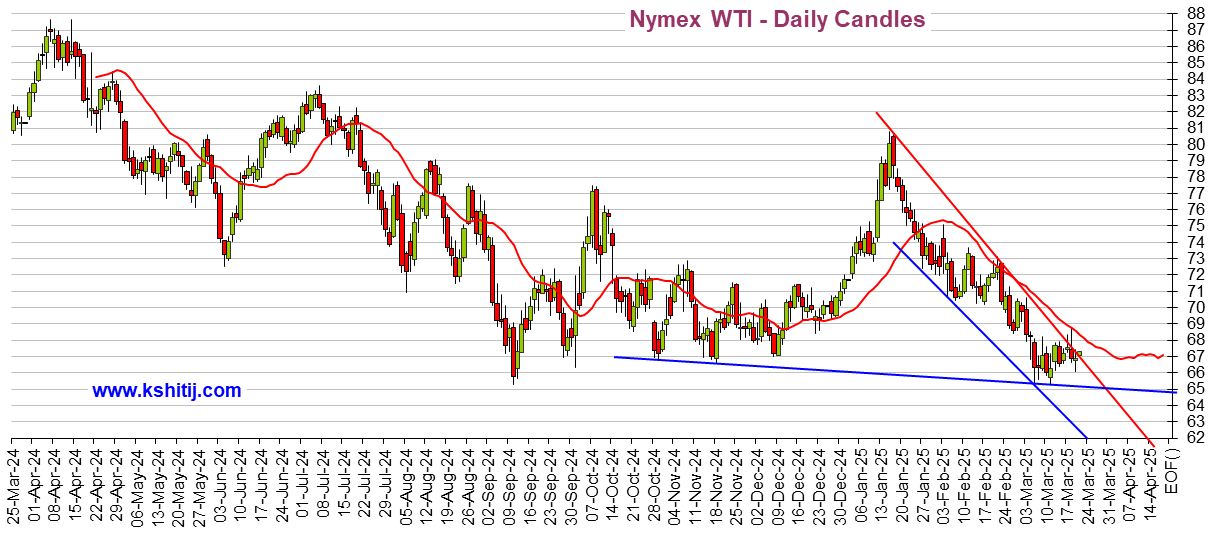
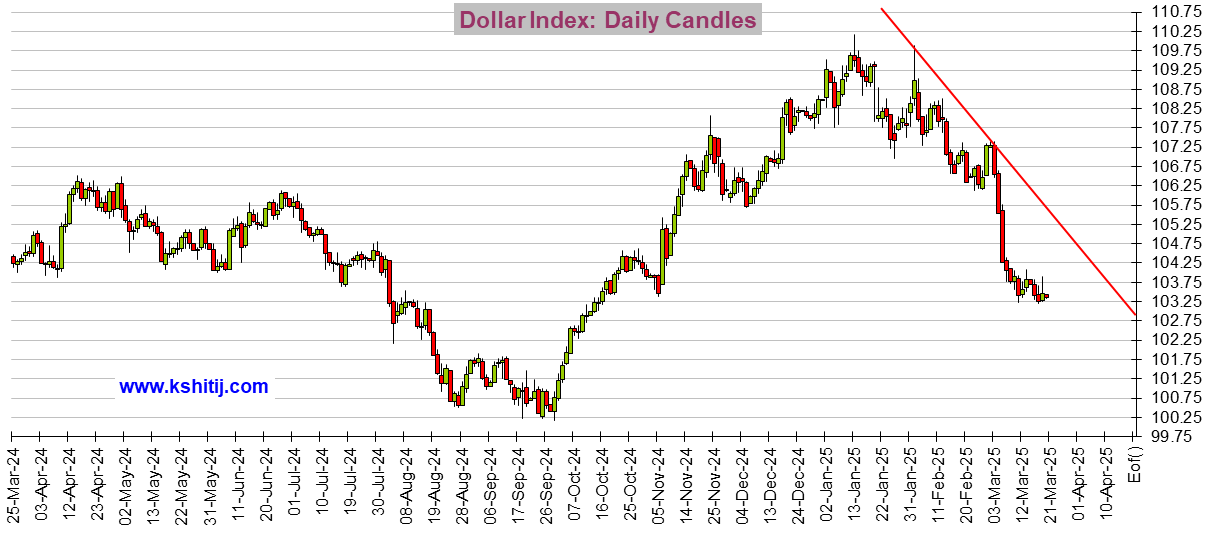
The graphs above and in the old Stock Market Watch update automatically. So they are up-to-date a few hours after each close.
Click LINKS TO GRAPHS (last Stock Market Watch - but note the graphs update automatically)
Or look above at the top of this OP for the 3 most important graphs:: Dow, Oil, and Dollar (they also update automatically). The other 2 graphs available at the above link are two currencies: the Pound and the Euro
Click bond yields and interest rates (post#4 below)
LISTMANIA
# Better than Biden. Ways EVERYTHING is (NOT) better now, usonian , /111699331
# Notes on the Crises: Currently: Comprehensive coverage of the T&M Treasury Payments Crisis of 2025, usonian, (it's pinned in the Economy Group) /111699437
# NAACP lists companies that dump DEI in its tactical spending guide for Black Americans, BumRushDaShow, /10143397368
# List of DUers on BlueSky, Native, /100220012446
===========================================================================
I always enjoyed scrolling through the graphs to see the trends, THANKS TANSY_GOLD !!!
Fortunately, since they update on their own, we can still see the latest (as of today's close, a few hours after the close) or as of the preceding day's close, even though the SMW is weeks or months old.
Unfortunately the text (e.g. Dow, S&P 500, and Nasdaq) don't update, maybe there's a source for those that can be embedded and updates itself like the graphs, I'm not willing to type these in every day. Maybe weekly at the end of the week. I'll ask General Computer Help for any ideas if somebody doesn't have a solution here.
Myself, I look at the "ribbon of market values" at the top of https://finance.yahoo.com , but I've long been set to the old version of that page, and I'm not sure anyone new to that page see that ribbon of values at the top (or try this, its always had the ribbon : https://finance.yahoo.com/calendar )
S&P 500, Dow 30, Nasdaq, Russell 2000 (small caps), Crude Oil, Gold, Silver, Euro, 10-Year Treasury, Pound, Yen, Bitcoin, XRP (some cryptocurrency thing), FTSE (UK market), Nikkei
Trouble in paradise: Much of the time, after market close, when I click the above finance.yahoo.com or finance.yahoo.com/calendar link, it shows me futures. Sometimes that's what I want. But often I want to see the last closing price. And when the market is open, it shows the current moment's prices. That is usually what I want, but if I'm wanting to see the last closing prices, well, its additional work to get those, one at a time, e.g. click on Dow and then it will put up a page with last closing price and numerous other stats. Repeat above for the S&P 500 ... It's strange that in this day and age everything has to be so damn hard when it could be real easy.
Bonds Here's a mini-page on current yields of Treasuries: 13 week, 5Y, 10Y, and 30Y. https://finance.yahoo.com/bonds/
(The "CBOE Interest Rate 10 Year T No" is just the 10 year treasury yield. Why they couldn't label it "Treasury Yield 10 Years" -- the same as they label the 5 year version "Treasury Yield 5 Years", and the 30 year version "Treasury Yield 30 Years" -- I don't know
For more on bonds, see post#4 .
A few more useful links
GDPNow (estimate of GDP in next quarter) -
Latest Inflation graphs and summary table for all 3 major inflation measures: CPI, PCE, PPI (wholesale prices), both the headline "all items" version and the "core" version. The next update will be when the CPI comes out October 10 (followed by the PPI the next day). If I'm tardy in updating the above link, try my journal, it should be near the top.
FedWatch - CME FedWatch Tool (predicts Feds Fund rates) https://www.cmegroup.com/markets/interest-rates/cme-fedwatch-tool.html
Economic Reports Calendar - https://www.marketwatch.com/economy-politics/calendar MahatmaKaneJeeves thread of this calendar - dunno if the link is permanent, so for now look for it in pinned posts at the top of the Economy Group listings.
Graphs. And a "sticky" Core PPI and enhanced probability (87%) that Feds will cut only 0.25%
The inflation situation as of the release of the CPI on 9/11/24 and the PPI (producer price index) on 9/12/24. Here is a summary table followed by the graphs.
Thanks to the sticky CORE CPI, the CME Fedwatch tool https://www.cmegroup.com/markets/interest-rates/cme-fedwatch-tool.html is predicting an 87% chance the Fed will cut interest rates a quarter of a point, and 13% chance they will cut half a point. Last week, before yesterday's CPI and today's PPI reports, they were predicting a 60% chance the Fed will cut interest rates a quarter of a point, and 40% chance they will cut half a point.
I annualize them all to be easy to compare to each other, and to compare to the FED's 2% goal. I use the actual index values rather than the one-digit changes that are commonly reported in the media. Links to the data are with the graphs.
ALL the numbers are the seasonally adjusted ones
The "1 month" number is the change from July to August expressed as an annualized number. Except the PCE is the increase from June to July, also annualized.
The "3 month" number is the growth over the last 3 months (and then annualized). It is calculated based on the change in the index number between the latest one and the one 3 months previous. e.g. if the latest index value is 304 and the one 3 months previous is 300, then the 3 month increase is 1.333333%
. . . (304/300 = 1.01333333 => [subtract 1 and multiply by 100%] => 1.333333%)
Annualized, it is 5.4%
. . . (1.01333333^4 = 1.0544095 => [subtract 1 and multiply by 100%] => 5.44095% => 5.4%).
. . . Most people just multiply the 3 month increase by 4 to annualize it: 1.333333%*4 = 5.333333% => 5.3% which isn''t technically correct (it leaves out compounding) but it is close for small percentage changes.
"Regular" is the "headline" number that has "everything"
"Core" is the regular with food and energy removed (The Fed prefers this as a basis for projecting FUTURE inflation)
Finally, the main summary table
All are seasonally adjusted and ANNUALIZED
PCE-Personal Consumption Expenditures Price Index (Fed's favorite inflation measure)
CPI-Consumer Price Index (retail)
PPI-Producer Price Index (Wholesale prices)
Links to the data are with the graphs below

Average real (i.e. inflation-adjusted) hourly earnings are up over the past 2 years and are above the pre-pandemic level:
. . . # Real average hourly earnings of production and non-supervisory workers: https://data.bls.gov/timeseries/CES0500000032
. . . # Real average hourly earnings of private sector workers: https://data.bls.gov/timeseries/CES0500000013
And now the graphs, in the following order:
* Core CPI and Regular CPI
* Core PCE and Regular PCE (Core PCE is the Fed's favorite for projecting FUTURE inflation)
* Wholesale inflation - Core PPI and Regular PPI < == This is from today, 9/12/24. Scroll down (or Control End) to see it
CORE CPI through August that came out 9/11/24
CORE CPI (seasonally adjusted) http://data.bls.gov/timeseries/CUSR0000SA0L1E
BLS CPI news release: https://www.bls.gov/news.release/cpi.nr0.htm
The Regular aka Headline CPI through August that came out 9/11/24 (CPI=Consumer Price Index)
Regular CPI (seasonally adjusted) https://data.bls.gov/timeseries/CUSR0000SA0
BLS CPI news release: https://www.bls.gov/news.release/cpi.nr0.htm
Some Additional CPI Series of Interest
Shelter, which is pretty much all rent -- either regular rent or "owners' equivalent rent", has been a problematic issue -- because changes in new rents take several months before they appreciably move the CPI (because of the inertia of 11 months of older rents). It is the largest component of the Core CPI and one of the largest of the regular CPI. Through August, shelter remained elevated at 0.4% month over month for several months, except for a smaller 0.2% increase in June., and a larger 0.5% increase in August. Year-over-year, shelter is up 5.2%
Shelter: https://data.bls.gov/timeseries/CUSR0000SAH1
Core Inflation less Shelter: https://data.bls.gov/timeseries/CUSR0000SA0L12E
^--This is up 0.0% for 3 months in a row, followed by +0.1% in August. The 3 month annualized average is +0.0% (compare to core of +2.1%)
Click on "More Formatting Options" on the upper right hand of screen, and on the page that appears, choose some or all of: "1-Month Percent Change", "3-Month Percent Change" and "12-Month Percent Change".
Headline CPI and Fed Rate Action
November 2019 through August 2024
The first tentative little quarter point rate increase was March 17, 2022, 12 months after year-over-year inflation went north of 2% in March 2021, and had reached 8.5%.
I'm fond of the 3 month averages as they are an average of 3 data points (so can't be easily dismissed as a "one off", unlike a single month-over-month figure), and they have much more recency than 12 month averages (yoy). I think of them as kinda a smoothed version of month-to-month.
FedFunds Target Rate (I used the upper end of the 0.25% width bracket): https://www.federalreserve.gov/monetarypolicy/openmarket.htm
CORE PCE through JULY that came out 8/30/24 (PCE=Personal Consumption Expenditures price index)
CORE PCE (seasonally adjusted): https://fred.stlouisfed.org/series/PCEPILFE
BEA.gov News release: https://www.bea.gov/ and click on "Personal Income and Outlays" or "Personal Income"
This is the one that the Fed weighs most heavily. The Fed weigh the PCE more heavily than the CPI. And in both cases, they weigh the CORE measures higher than the regular headline measures for projecting FUTURE inflation

Regular PCE through JULY that came out 8/30/24
Regular PCE (seasonally adjusted): https://fred.stlouisfed.org/series/PCEPI
BEA.gov News release: https://www.bea.gov/ and click on "Personal Income and Outlays" or "Personal Income"

WHOLESALE INFLATION (PPI - the Producer Price Index)
https://www.bls.gov/news.release/ppi.nr0.htm
As for which core PPI measure, since the BLS highlights the one below (without food, energy, and trade services) in its reporting (as opposed to the one without food and energy), then I guess I should do likewise. Trade services bounce around a lot from month to month, so I think excluding them from a core measure is the right thing to do.
CORE PPI (excluding food, energy, trade services) through August that came out 9/12/24:
CORE PPI (seasonally adjusted) http://data.bls.gov/timeseries/WPSFD49116
===========================================================
Regular PPI through August that came out 9/12/24 ( includes "everything" ):
Regular PPI (seasonally adjusted) http://data.bls.gov/timeseries/WPSFD4
Graphs. And a discrepancy in the BLS numbers on 12 month inflation
The inflation situation as of the release of the CPI on 9/11/24. Here is a summary table followed by the graphs.
I annualize them all to be easy to compare to each other, and to compare to the FED's 2% goal. I use the actual index values rather than the one-digit changes that are commonly reported in the media. Links to the data are with the graphs.
ALL the numbers are the seasonally adjusted ones
The "1 month" number is the change from June to July expressed as an annualized number. Except the CPI (today's report) is the increase from July to August, also annualized.
The "3 month" number is the growth over the last 3 months (and then annualized). It is calculated based on the change in the index number between the latest one and the one 3 months previous. e.g. if the latest index value is 304 and the one 3 months previous is 300, then the 3 month increase is 1.333333%
. . . (304/300 = 1.01333333 => [subtract 1 and multiply by 100%] => 1.333333%)
Annualized, it is 5.4%
. . . (1.01333333^4 = 1.0544095 => [subtract 1 and multiply by 100%] => 5.44095% => 5.4%).
. . . Most people just multiply the 3 month increase by 4 to annualize it: 1.333333%*4 = 5.333333% => 5.3% which isn''t technically correct (it leaves out compounding) but it is close for small percentage changes.
"Regular" is the "headline" number that has "everything"
"Core" is the regular with food and energy removed (The Fed prefers this as a basis for projecting FUTURE inflation)
Finally, the main summary table
All are seasonally adjusted and ANNUALIZED
PCE-Personal Consumption Expenditures Price Index (Fed's favorite inflation measure)
CPI-Consumer Price Index (retail)
PPI-Producer Price Index (Wholesale prices)
Links to the data are with the graphs below

. . ^^----- this is the discrepancy I mentioned in my title line
Average real (i.e. inflation-adjusted) hourly earnings are up over the past 2 years and are above the pre-pandemic level:
. . . # Real average hourly earnings of production and non-supervisory workers: https://data.bls.gov/timeseries/CES0500000032
. . . # Real average hourly earnings of private sector workers: https://data.bls.gov/timeseries/CES0500000013
And now the graphs, in the following order:
* Core CPI and Regular CPI
* Core PCE and Regular PCE (Core PCE is the Fed's favorite for projecting FUTURE inflation)
* Wholesale inflation - Core PPI and Regular PPI
CORE CPI through August that came out 9/11/24
CORE CPI (seasonally adjusted) http://data.bls.gov/timeseries/CUSR0000SA0L1E
BLS CPI news release: https://www.bls.gov/news.release/cpi.nr0.htm
The Regular aka Headline CPI through August that came out 9/11/24 (CPI=Consumer Price Index)
Regular CPI (seasonally adjusted) https://data.bls.gov/timeseries/CUSR0000SA0
BLS CPI news release: https://www.bls.gov/news.release/cpi.nr0.htm
Some Additional CPI Series of Interest
Shelter, which is pretty much all rent -- either regular rent or "owners' equivalent rent", has been a problematic issue -- because changes in new rents take several months before they appreciably move the CPI (because of the inertia of 11 months of older rents). It is the largest component of the Core CPI and one of the largest of the regular CPI. Through August, shelter remained elevated at 0.4% month over month for several months, except for a smaller 0.2% increase in June., and a larger 0.5% increase in August. Year-over-year, shelter is up 5.2%
Shelter: https://data.bls.gov/timeseries/CUSR0000SAH1
Core Inflation less Shelter: https://data.bls.gov/timeseries/CUSR0000SA0L12E
^--This is up 0.0% for 3 months in a row, followed by +0.1% in August. The 3 month annualized average is +0.0% (compare to core of +2.1%)
Click on "More Formatting Options" on the upper right hand of screen, and on the page that appears, choose some or all of: "1-Month Percent Change", "3-Month Percent Change" and "12-Month Percent Change".
Headline CPI and Fed Rate Action
November 2019 through August 2024
The first tentative little quarter point rate increase was March 17, 2022, 12 months after year-over-year inflation went north of 2% in March 2021, and had reached 8.5%.
I'm fond of the 3 month averages as they are an average of 3 data points (so can't be easily dismissed as a "one off", unlike a single month-over-month figure), and they have much more recency than 12 month averages (yoy). I think of them as kinda a smoothed version of month-to-month.
FedFunds Target Rate (I used the upper end of the 0.25% width bracket): https://www.federalreserve.gov/monetarypolicy/openmarket.htm
CORE PCE through JULY that came out 8/30/24 (PCE=Personal Consumption Expenditures price index)
CORE PCE (seasonally adjusted): https://fred.stlouisfed.org/series/PCEPILFE
BEA.gov News release: https://www.bea.gov/ and click on "Personal Income and Outlays" or "Personal Income"
This is the one that the Fed weighs most heavily. The Fed weigh the PCE more heavily than the CPI. And in both cases, they weigh the CORE measures higher than the regular headline measures for projecting FUTURE inflation
Regular PCE through JULY that came out 8/30/24
Regular PCE (seasonally adjusted): https://fred.stlouisfed.org/series/PCEPI
BEA.gov News release: https://www.bea.gov/ and click on "Personal Income and Outlays" or "Personal Income"
WHOLESALE INFLATION (PPI - the Producer Price Index)
https://www.bls.gov/news.release/ppi.nr0.htm
As for which core PPI measure, since the BLS highlights the one below (without food, energy, and trade services) in its reporting (as opposed to the one without food and energy), then I guess I should do likewise. Trade services bounce around a lot from month to month, so I think excluding them from a core measure is the right thing to do.
CORE PPI (excluding food, energy, trade services) through July that came out 8/13/24:
CORE PPI (seasonally adjusted) http://data.bls.gov/timeseries/WPSFD49116

===========================================================
Regular PPI through July that came out 8/13/24 ( includes "everything" ):
Regular PPI (seasonally adjusted) http://data.bls.gov/timeseries/WPSFD4

Graphs of PCE, CPI, and PPI
The inflation situation as of the release of the PCE on 8/30/24. Here is a summary table followed by the graphs.
I annualize them all to be easy to compare to each other, and to compare to the FED's 2% goal. I use the actual index values rather than the one-digit changes that are commonly reported in the media. Links to the data are with the graphs.
ALL the numbers are the seasonally adjusted ones
The "1 month" number is the change from June to July expressed as an annualized number. Except the PCE is the increase from May to June, also annualized.
The "3 month" number is the growth over the last 3 months (and then annualized). It is calculated based on the change in the index number between the latest one and the one 3 months previous. e.g. if the latest index value is 304 and the one 3 months previous is 300, then the 3 month increase is 1.333333%
. . . (304/300 = 1.01333333 => [subtract 1 and multiply by 100%] => 1.333333%)
Annualized, it is 5.4%
. . . (1.01333333^4 = 1.0544095 => [subtract 1 and multiply by 100%] => 5.44095% => 5.4%).
. . . Most people just multiply the 3 month increase by 4 to annualize it: 1.333333%*4 = 5.333333% => 5.3% which isn''t technically correct (it leaves out compounding) but it is close for small percentage changes.
"Regular" is the "headline" number that has "everything"
"Core" is the regular with food and energy removed (The Fed prefers this as a basis for projecting FUTURE inflation)
Finally, the main summary table
All are seasonally adjusted and ANNUALIZED
PCE-Personal Consumption Expenditures Price Index (Fed's favorite inflation measure)
CPI-Consumer Price Index (retail)
PPI-Producer Price Index (Wholesale prices)
Links to the data are with the graphs below

Average real (i.e. inflation-adjusted) hourly earnings are up over the past 2 years and are above the pre-pandemic level:
. . . # Real average hourly earnings of production and non-supervisory workers: https://data.bls.gov/timeseries/CES0500000032
. . . # Real average hourly earnings of private sector workers: https://data.bls.gov/timeseries/CES0500000013
And now the graphs, in the following order:
* Core PCE and Regular PCE (Core PCE is the Fed's favorite for projecting FUTURE inflation)
* Core CPI and Regular CPI
* Wholesale inflation - Core PPI and Regular PPI
CORE PCE through JULY that came out 8/30/24 (PCE=Personal Consumption Expenditures price index)
CORE PCE (seasonally adjusted): https://fred.stlouisfed.org/series/PCEPILFE
BEA.gov News release: https://www.bea.gov/ and click on "Personal Income and Outlays" or "Personal Income"
This is the one that the Fed weighs most heavily. The Fed weigh the PCE more heavily than the CPI. And in both cases, they weigh the CORE measures higher than the regular headline measures for projecting FUTURE inflation
Regular PCE through JULY that came out 8/30/24
Regular PCE (seasonally adjusted): https://fred.stlouisfed.org/series/PCEPI
BEA.gov News release: https://www.bea.gov/ and click on "Personal Income and Outlays" or "Personal Income"
CORE CPI through July that came out 8/14/24
CORE CPI (seasonally adjusted) http://data.bls.gov/timeseries/CUSR0000SA0L1E
BLS CPI news release: https://www.bls.gov/news.release/cpi.nr0.htm

The Regular aka Headline CPI through July that came out 8/14/24 (CPI=Consumer Price Index)
Regular CPI (seasonally adjusted) https://data.bls.gov/timeseries/CUSR0000SA0
BLS CPI news release: https://www.bls.gov/news.release/cpi.nr0.htm

Some Additional CPI Series of Interest
Shelter, which is pretty much all rent -- either regular rent or "owners' equivalent rent", has been a problematic issue -- because changes in new rents take several months before they appreciably move the CPI (because of the inertia of 11 months of older rents). It is the largest component of the Core CPI and one of the largest of the regular CPI. Through July, shelter remained elevated at 0.4% month over month for several months, except for a smaller 0.2% increase in June. Year-over-year, shelter is up 5.0%
Shelter: https://data.bls.gov/timeseries/CUSR0000SAH1
Core Inflation less Shelter: https://data.bls.gov/timeseries/CUSR0000SA0L12E
^--This is up 0.0% for a 3rd month in a row, and a 3 month annualized average of +0.0% (compare to core of +1.6%)
Click on "More Formatting Options" on the upper right hand of screen, and on the page that appears, choose some or all of: "1-Month Percent Change", "3-Month Percent Change" and "12-Month Percent Change".
Headline CPI and Fed Rate Action

November 2019 through July 2024
The first tentative little quarter point rate increase was March 17, 2022, 12 months after year-over-year inflation went north of 2% in March 2021, and had reached 8.5%.
I'm fond of the 3 month averages as they are an average of 3 data points (so can't be easily dismissed as a "one off", unlike a single month-over-month figure), and they have much more recency than 12 month averages (yoy). I think of them as kinda a smoothed version of month-to-month.
FedFunds Target Rate (I used the upper end of the 0.25% width bracket): https://www.federalreserve.gov/monetarypolicy/openmarket.htm
WHOLESALE INFLATION (PPI - the Producer Price Index)
https://www.bls.gov/news.release/ppi.nr0.htm
As for which core PPI measure, since the BLS highlights the one below (without food, energy, and trade services) in its reporting (as opposed to the one without food and energy), then I guess I should do likewise. Trade services bounce around a lot from month to month, so I think excluding them from a core measure is the right thing to do.
CORE PPI (excluding food, energy, trade services) through July that came out 8/13/24:
CORE PPI (seasonally adjusted) http://data.bls.gov/timeseries/WPSFD49116
===========================================================
Regular PPI through July that came out 8/13/24 ( includes "everything" ):
Regular PPI (seasonally adjusted) http://data.bls.gov/timeseries/WPSFD4
Inflation graphs
The inflation situation as of the release of the CPI on 8/14/24. Here is a summary table followed by the graphs.
I annualize them all to be easy to compare to each other, and to compare to the FED's 2% goal. I use the actual index values rather than the one-digit changes that are commonly reported in the media. Links to the data are with the graphs.
ALL the numbers are the seasonally adjusted ones
The "1 month" number is the change from June to July expressed as an annualized number. Except the PCE is the increase from May to June, also annualized.
The "3 month" number is the growth over the last 3 months (and then annualized). It is calculated based on the change in the index number between the latest one and the one 3 months previous. e.g. if the latest index value is 304 and the one 3 months previous is 300, then the 3 month increase is 1.333333%
. . . (304/300 = 1.01333333 => [subtract 1 and multiply by 100%] => 1.333333%)
Annualized, it is 5.4%
. . . (1.01333333^4 = 1.0544095 => [subtract 1 and multiply by 100%] => 5.44095% => 5.4%).
. . . Most people just multiply the 3 month increase by 4 to annualize it: 1.333333%*4 = 5.333333% => 5.3% which isn''t technically correct (it leaves out compounding) but it is close for small percentage changes.
"Regular" is the "headline" number that has "everything"
"Core" is the regular with food and energy removed (The Fed prefers this as a basis for projecting FUTURE inflation)
Finally, the main summary table
All are seasonally adjusted and ANNUALIZED
PCE-Personal Consumption Expenditures Price Index (Fed's favorite inflation measure)
CPI-Consumer Price Index (retail)
PPI-Producer Price Index (Wholesale prices)
Links to the data are with the graphs below

Average real (i.e. inflation-adjusted) hourly earnings are up over the past 2 years and are above the pre-pandemic level:
. . . # Real average hourly earnings of production and non-supervisory workers: https://data.bls.gov/timeseries/CES0500000032
. . . # Real average hourly earnings of private sector workers: https://data.bls.gov/timeseries/CES0500000013
And now the graphs, in the following order:
* Core CPI and Regular CPI
* Core PCE and Regular PCE (Core PCE is the Fed's favorite for projecting FUTURE inflation)
* Wholesale inflation - Core PPI and Regular PPI
CORE CPI through July that came out 8/14/24
CORE CPI (seasonally adjusted) http://data.bls.gov/timeseries/CUSR0000SA0L1E
BLS CPI news release: https://www.bls.gov/news.release/cpi.nr0.htm
The Regular aka Headline CPI through July that came out 8/14/24 (CPI=Consumer Price Index)
Regular CPI (seasonally adjusted) https://data.bls.gov/timeseries/CUSR0000SA0
BLS CPI news release: https://www.bls.gov/news.release/cpi.nr0.htm
Some Additional CPI Series of Interest
Shelter, which is pretty much all rent -- either regular rent or "owners' equivalent rent", has been a problematic issue -- because changes in new rents take several months before they appreciably move the CPI (because of the inertia of 11 months of older rents). It is the largest component of the Core CPI and one of the largest of the regular CPI. Through July, shelter remained elevated at 0.4% month over month for several months, except for a smaller 0.2% increase in June. Year-over-year, shelter is up 5.0%
Shelter: https://data.bls.gov/timeseries/CUSR0000SAH1
Core Inflation less Shelter: https://data.bls.gov/timeseries/CUSR0000SA0L12E
^--This is up 0.0% for a 3rd month in a row, and a 3 month annualized average of +0.0% (compare to core of +1.6%)
Click on "More Formatting Options" on the upper right hand of screen, and on the page that appears, choose some or all of: "1-Month Percent Change", "3-Month Percent Change" and "12-Month Percent Change".
Headline CPI and Fed Rate Action
November 2019 - July 2024
The first tentative little quarter point rate increase was March 17, 2022, 12 months after year-over-year inflation went north of 2% in March 2021, and had reached 8.5%.
I'm fond of the 3 month averages as they are an average of 3 data points (so can't be easily dismissed as a "one off", unlike a single month-over-month figure), and they have much more recency than 12 month averages (yoy). I think of them as kinda a smoothed version of month-to-month.
FedFunds Target Rate (I used the upper end of the 0.25% width bracket): https://www.federalreserve.gov/monetarypolicy/openmarket.htm
CORE PCE through JUNE that came out 7/26/24 (PCE=Personal Consumption Expenditures price index)
CORE PCE (seasonally adjusted): https://fred.stlouisfed.org/series/PCEPILFE
BEA.gov News release: https://www.bea.gov/ and click on "Personal Income and Outlays" or "Personal Income"
This is the one that the Fed weighs most heavily. The Fed weigh the PCE more heavily than the CPI. And in both cases, they weigh the CORE measures higher than the regular headline measures for projecting FUTURE inflation
I usually don't include the 6-month rolling average, but I had it handy, and it is fascinating how it gives such a different picture than the rolling 3 month average. The big reason for the difference is the huge January month-over-month increase (6.2% annualized), which is in the 6 month window, but not in the 3 month window. When January drops out of the 6 month window next month, it should look a lot different (i.e. it will show a downturn barring a shocker in next month's report)

Regular PCE through JUNE that came out 7/26/24
Regular PCE (seasonally adjusted): https://fred.stlouisfed.org/series/PCEPI
BEA.gov News release: https://www.bea.gov/ and click on "Personal Income and Outlays" or "Personal Income"

WHOLESALE INFLATION (PPI - the Producer Price Index)
https://www.bls.gov/news.release/ppi.nr0.htm
As for which core PPI measure, since the BLS highlights the one below in its reporting (as opposed to the one without food and energy), then I guess I should do likewise.
CORE PPI (excluding food, energy, trade services) through July that came out 8/13/24:
CORE PPI (seasonally adjusted) http://data.bls.gov/timeseries/WPSFD49116
===========================================================
Regular PPI through July that came out 8/13/24 ( includes "everything" ):
Regular PPI (seasonally adjusted) http://data.bls.gov/timeseries/WPSFD4
Profile Information
Gender: MaleHometown: Minnesota
Member since: Sat Jan 1, 2005, 04:45 AM
Number of posts: 11,774